


Official Supplier
As official and authorized distributors, we supply you with legitimate licenses directly from 200+ software publishers.
See all our Brands.
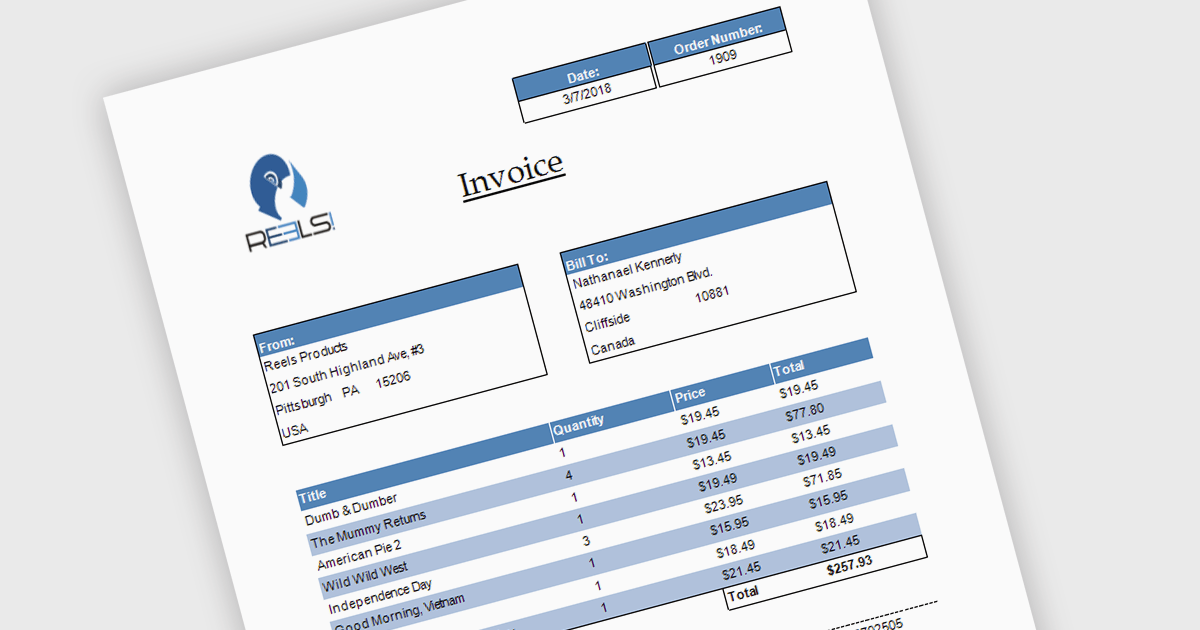
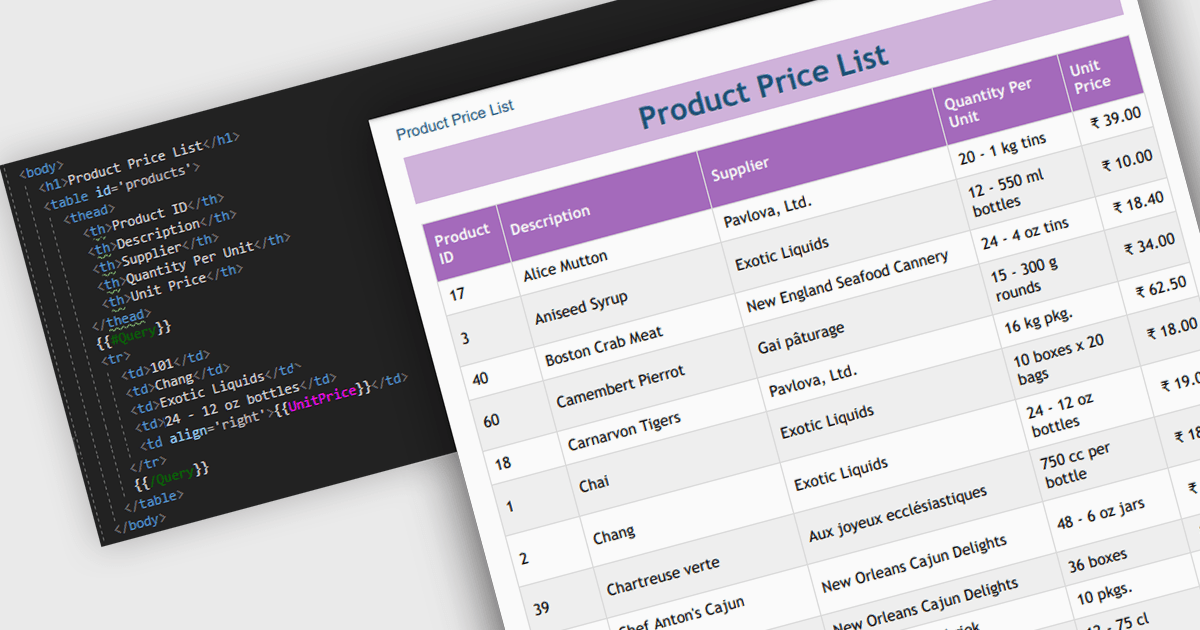
Subreports allow you to embed one report within another, making it easy to display related or detailed information alongside primary report data. By organizing complex reports into reusable sections, subreports improve clarity, simplify maintenance, and reduce development effort. They also support hierarchical data and multiple data sources, making them ideal for invoices with line items, customer reports with purchase histories, and sales reports with detailed transaction data.
Several .NET reporting controls offer support for subreports including:
For an in-depth analysis of features and price, visit our .NET reporting controls comparison.
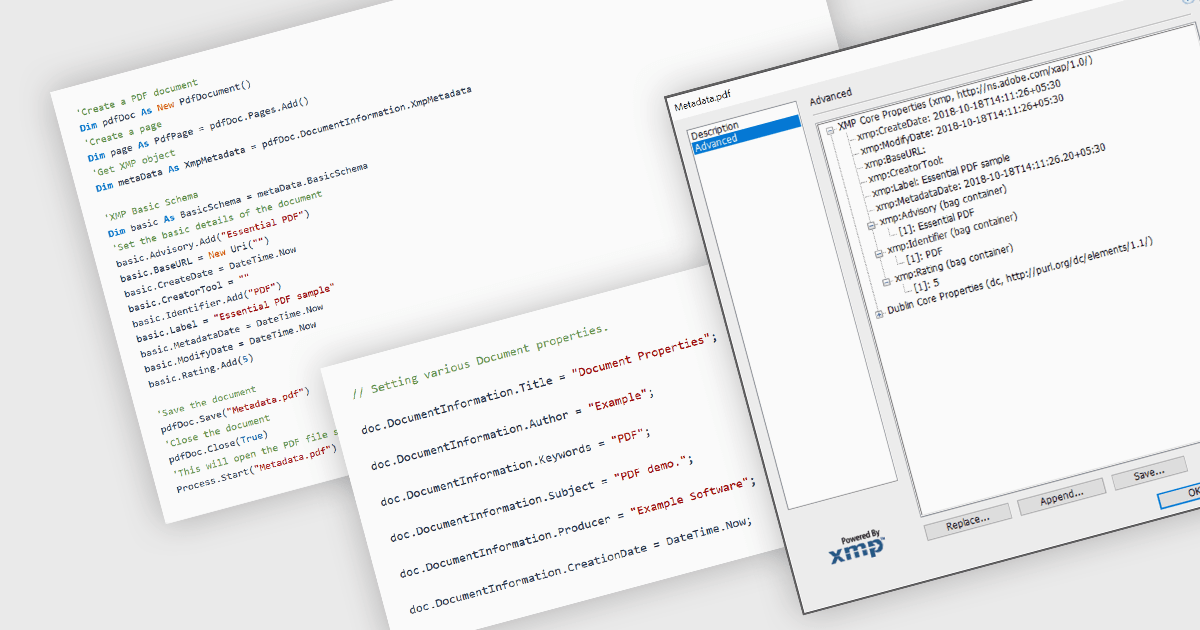
Managing the metadata of PDF documents involves viewing and maintaining information embedded within a PDF file, including standard document properties such as the title, author, subject, keywords, and creation date, as well as custom metadata. Maintaining accurate metadata helps improve document organization, supports search and indexing, simplifies document management, and assists with compliance and record-keeping by ensuring descriptive information remains consistent throughout a document's life cycle.
Several WinForms PDF components allow you to manage metadata, including:
For an in-depth analysis of features and price, visit our comparison of WinForms PDF components.
DevExpress Blazor (part of DevExpress ASP.NET and Blazor) helps you create high-impact user experiences for both Blazor Server and Blazor WebAssembly using C#. The Blazor UI Component Library ships with a comprehensive set of native components including a Grid, Pivot Table, Scheduler, Chart, Data Editors and Reporting.
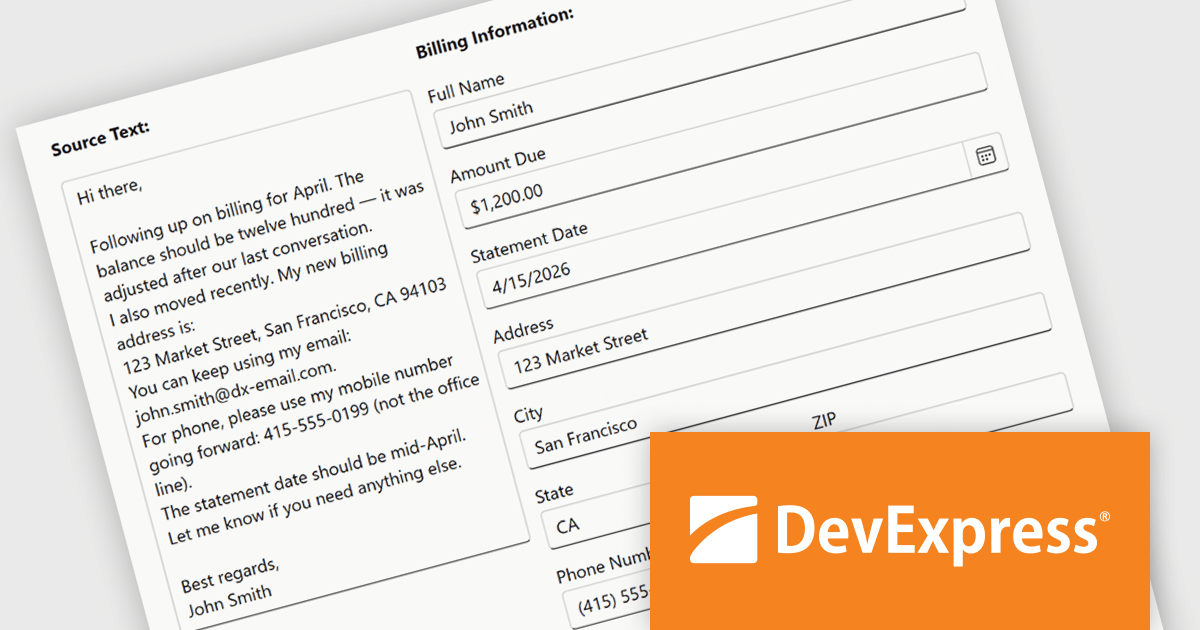
The DevExpress Blazor Form Layout component now includes Smart Paste, a new AI-powered capability designed to reduce manual data entry. Smart Paste can analyse unstructured content, such as email messages, support requests, or free-form notes, identify relevant information, and automatically populate matching form fields. This helps users transfer data into applications more quickly while reducing the risk of errors, making form-based workflows more efficient and easier to manage.
To see a full list of what's new in version 26.1, see our release notes.
DevExpress ASP.NET and Blazor is licensed per developer and is available as a Perpetual License with a 12 month support and maintenance subscription. See our DevExpress ASP.NET and Blazor licensing page for full details.
DevExpress Blazor is available in the following products:
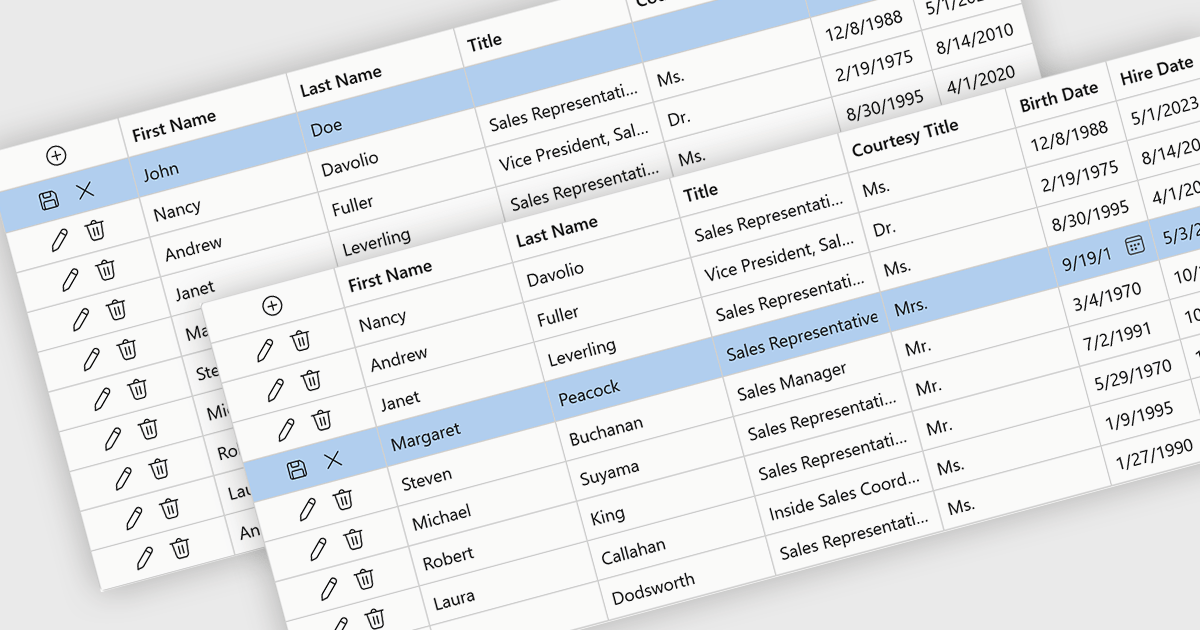
Row editing in grids allows users to update an entire record directly within a data grid, editing multiple fields at once without opening a separate form. This improves productivity by reducing clicks, keeping users in context, and making data updates faster and more intuitive. It also helps improve accuracy by allowing related information to be reviewed and validated together. Common use cases include managing customer records, updating inventory, processing orders, and maintaining employee or financial data in business applications.
Several .NET Blazor components provide data grids that allow row editing, including:
For an in-depth analysis of features and price, visit our comparison of .NET Blazor grid components.
Convert HTML to PDF is a feature in a .NET PDF Viewer component that enables developers to generate PDF documents from HTML content, including text, images, styles, and web-based layouts, while preserving the original formatting. It is commonly used for creating reports, invoices, forms, and archived web content directly within .NET applications. The capability helps maintain consistent document presentation across platforms, supports automated document generation workflows, reduces the need for manual formatting, and allows existing HTML and CSS assets to be reused when producing professional-quality PDF output.
Several .NET PDF components offer convert HTML to PDF including:
For an in-depth analysis of features and price, visit our comparison of .NET PDF components.


Tel: (888) 850 9911
Fax: +1 770 250 6199


