


Official Supplier
As official and authorized distributors, we supply you with legitimate licenses directly from 200+ software publishers.
See all our Brands.
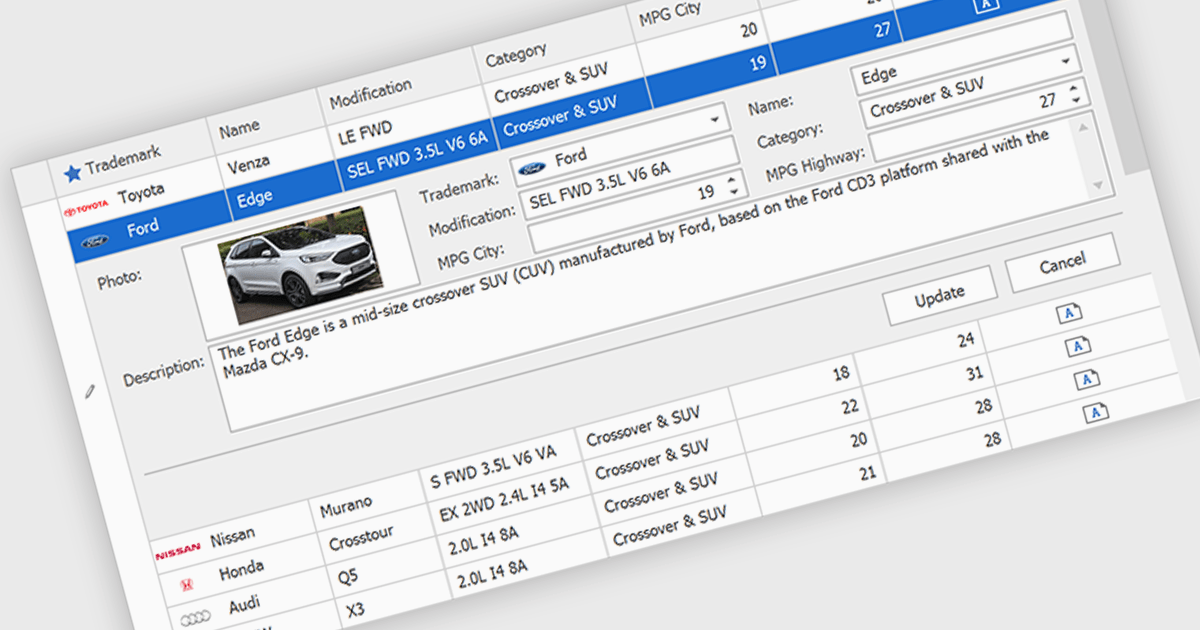
Customized Forms in .NET Grid components allow developers to tailor the structure and layout of data entry interfaces within grid-based controls, providing flexibility to match specific application requirements. These forms enable the addition of custom fields, validation logic, and user interface elements directly into the grid's editing workflow, enhancing the user experience and ensuring that data entry aligns with business rules. By offering control over how data is captured and displayed, customizable edit forms simplify complex data interactions, reduce the need for separate dialog windows, and support consistent, efficient data management within enterprise applications.
Many .NET Grid collections enable edit forms including:
For an in-depth analysis of features and price, visit our .NET grid controls comparison.
GroupDocs's Python via .NET product range is a comprehensive suite of high-performance APIs that allow developers to seamlessly integrate advanced document processing features into Python applications, while leveraging the robustness of the .NET framework. Designed for cross-platform compatibility, these libraries support a wide variety of document formats including PDF, Word, Excel, PowerPoint, and more. By bridging Python's simplicity with .NET's scalability, the product range empowers developers to build efficient, enterprise-grade solutions for viewing, editing, converting, and automating document workflows, all within a consistent and developer-friendly environment.
The recent expansion of the GroupDocs Python via .NET product range includes four new powerful APIs: GroupDocs.Comparison, GroupDocs.Merger, GroupDocs.Metadata, and GroupDocs.Watermark. These additions significantly enhance the toolkit's capabilities, enabling Python developers to programmatically compare content between documents, merge files with precision, manage and update metadata, and apply or remove watermarks for security and branding. Each API brings a focused, high-performance engine tailored for its respective function, ensuring reliability and accuracy across diverse file formats.
GroupDocs products are offered as Developer Small Business, Developer OEM, Site Small Business, and Site OEM licenses catering to a range of business needs. Licenses are perpetual, and include 1 year of support and maintenance. Subscription renewals are also available. For full details, see our licensing pages for GroupDocs.Comparison, GroupDocs.Merger, GroupDocs.Metadata, and GroupDocs.Watermark.
These new products are available individually or as part of GroupDocs.Total Product Family.
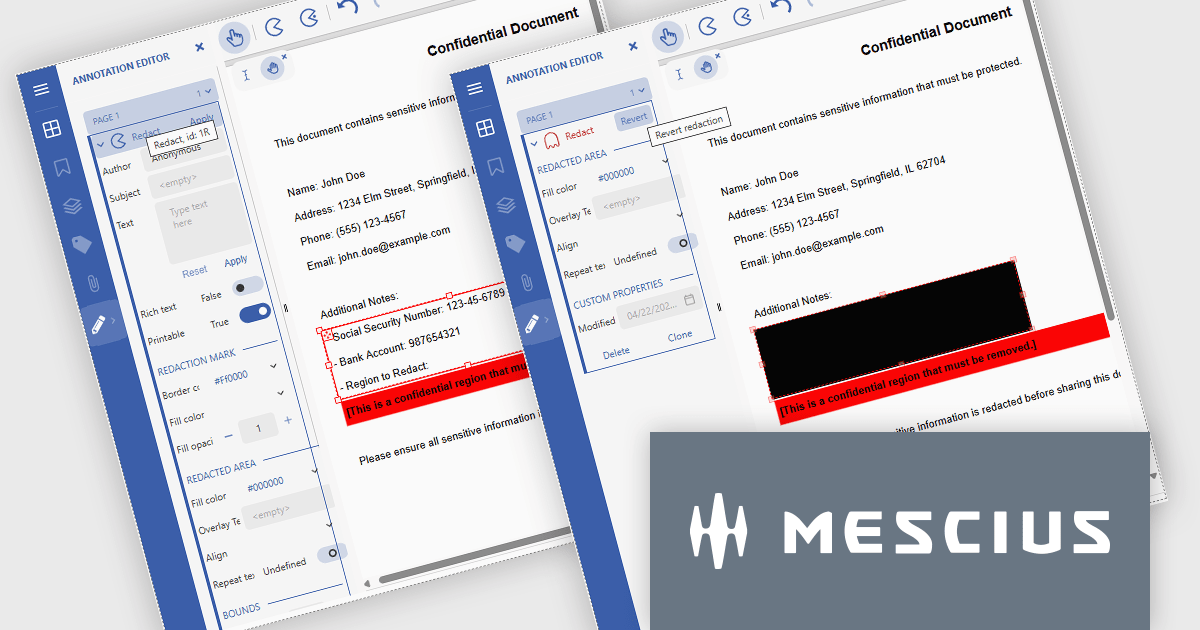
Document Solutions for PDF (DsPdf) by MESCIUS is a software development toolkit that provides .NET Core libraries and a JavaScript PDF viewer for manipulating and displaying PDFs. DsPdf enables developers to create, edit, annotate, and redact PDF documents directly within web applications. The included DsPdfViewer component offers a feature-rich, cross-platform solution for viewing and interacting with PDFs in modern browsers on various operating systems, including mobile devices.
The Document Solutions for PDF v8.1 update introduces robust redaction capabilities to the DsPdfViewer/Wasm, allowing users to add, edit, and apply redact annotations directly within the browser - without the need for a .NET server. This feature, available through the Professional DsPdfViewer license with WebAssembly (Wasm) SupportApi, ensures sensitive information can be securely removed or hidden with ease, enhancing compliance and document control in client-side PDF workflows.
To see a full list of what's new in version 8.1.0, see our release notes.
Document Solutions for PDF is licensed per developer and is available in several license options for differing distribution needs. Team licenses are also available for multiple developers within the same organization. See our Document Solutions for PDF licensing page for full details.
Document Solutions for PDF is available to buy individually or as part of Document Solutions .NET Bundle.
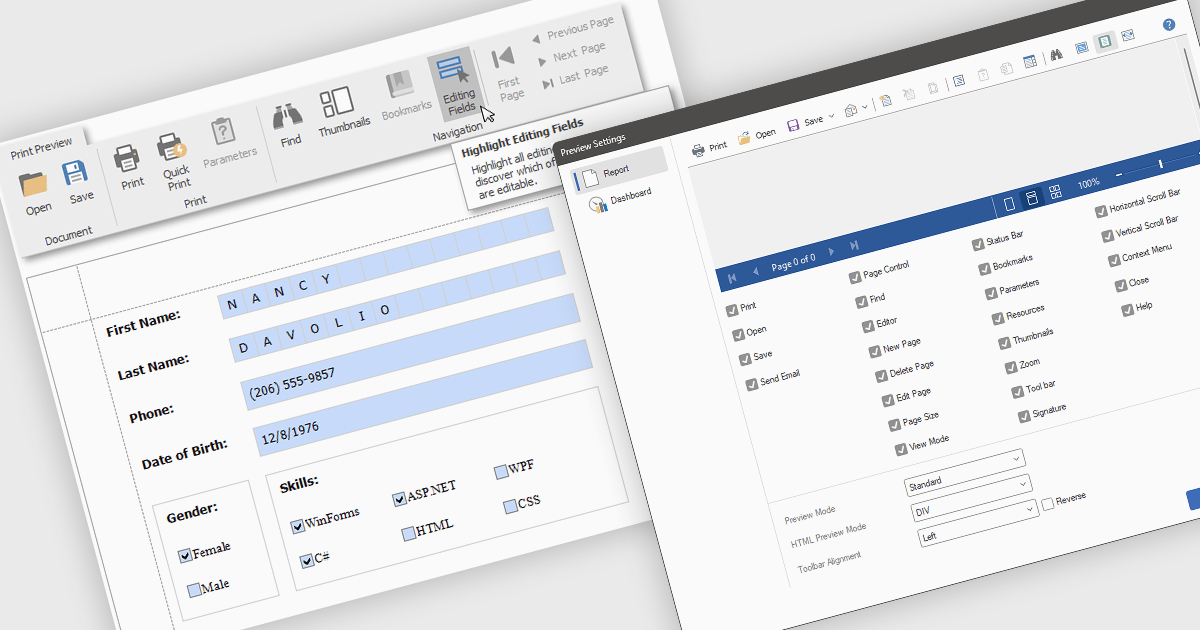
Editing reports in preview mode enables direct modification of report elements like text, charts, and layout within the review window. This approach offers benefits such as faster iteration, improved accuracy, and enhanced efficiency by eliminating the need to switch between edit and preview modes. Teams can adjust chart labels for clarity or tweak a report's layout for better presentation, instantly seeing the impact of their changes and improving the report finalization process.
Several .NET WPF Reporting Controls offer support for editing in preview including:
For an in-depth analysis of features and price, visit our comparison of .NET WPF Reporting Controls.
Syncfusion Essential Studio ASP.NET MVC (available as part of Syncfusion Essential Studio Enterprise) is a comprehensive suite of web UI controls that empowers developers to craft rich, interactive ASP.NET MVC applications. Backed by the lightweight and modular Essential JS 2 library, it offers over 80 components ranging from data grids and charts to schedulers and pivot grids, while ensuring a seamless integration with the MVC framework for an efficient development experience.
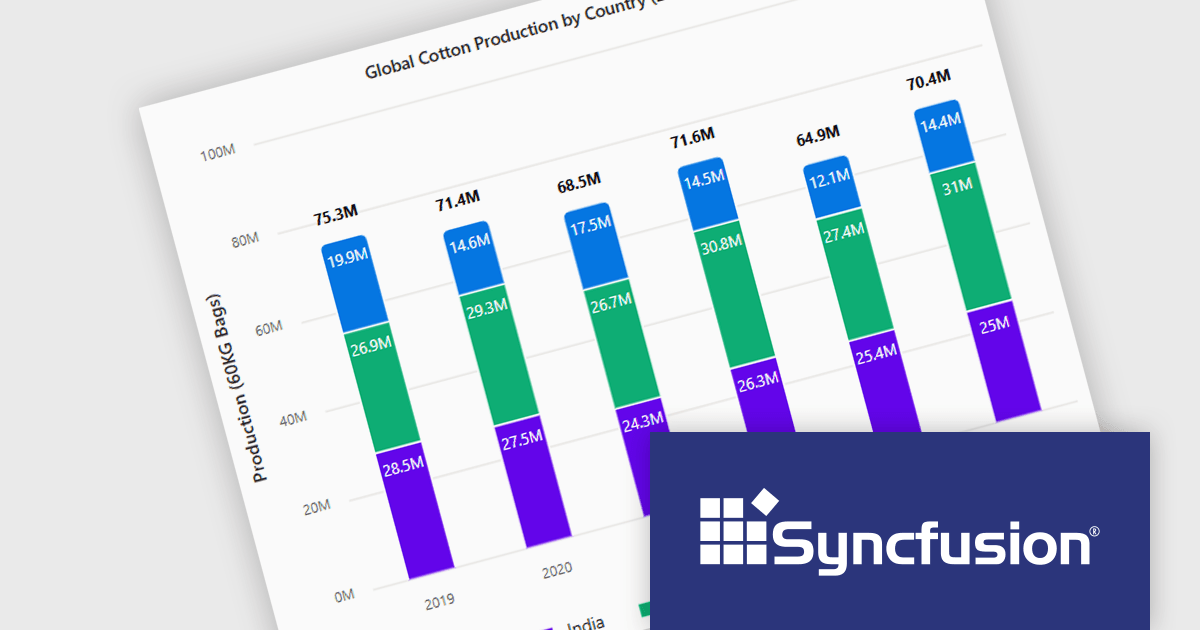
The Syncfusion Essential Studio ASP.NET MVC 2025 Volume 1 release introduces the ability to display cumulative totals directly within data labels on stacked charts. This enhancement provides immediate insight into the overall contributions of each category or series without requiring interaction or external calculations. By making the total visible at a glance, it improves data readability, supports faster decision making, and enhances dashboard usability, particularly in performance monitoring, financial reporting, and sales analysis applications.
To see a full list of what's new in 2025 Volume 1, see our release notes.
Syncfusion Essential Studio ASP.NET MVC is available as part of Syncfusion Essential Studio Enterprise which is licensed per developer starting with a Team License of up to five developers. It is available as a 12 Month Timed Subscription License which includes support and maintenance. See our Syncfusion Essential Studio Enterprise licensing page for full details.
Learn more on our Syncfusion Essential Studio ASP.NET MVC product page.


Tel: (888) 850 9911
Fax: +1 770 250 6199


