


Official Supplier
As official and authorized distributors, we supply you with legitimate licenses directly from 200+ software publishers.
See all our Brands.
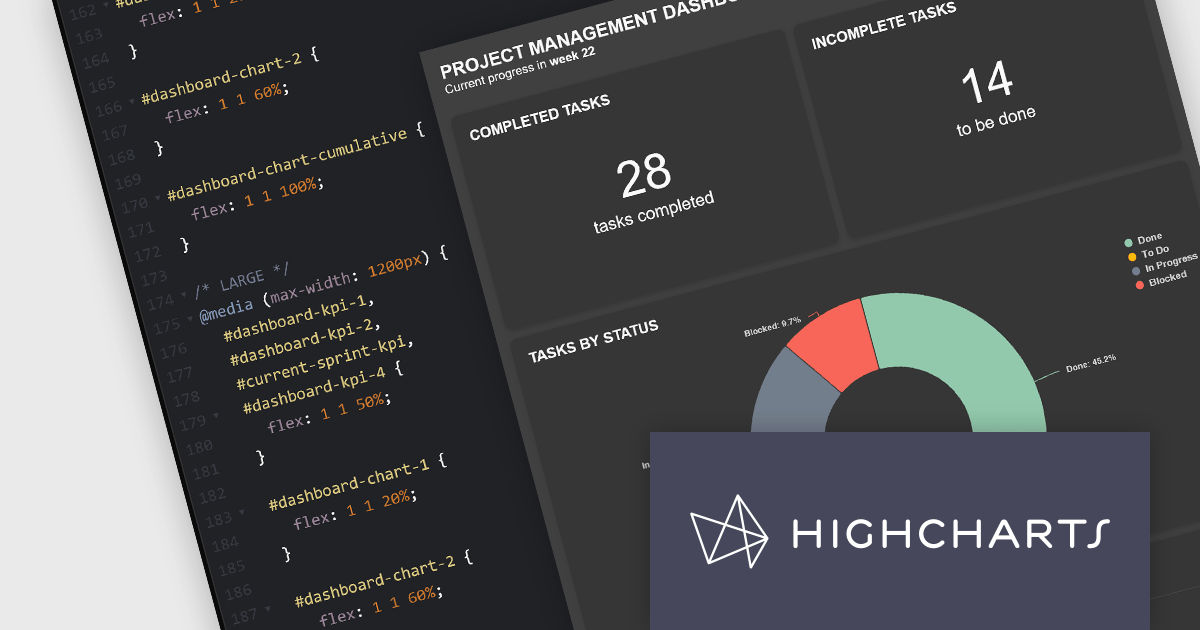
Highcharts Dashboards by Highsoft is a comprehensive platform tailored for software developers seeking efficient data visualization solutions. It offers a robust toolkit for creating interactive dashboards and charts, leveraging the Highcharts library renowned for its flexibility and performance. With support for various data formats and extensive customization options, developers can seamlessly integrate dynamic visualizations into their applications. Highsoft's dashboards empower developers to convey complex data insights effectively, enhancing user experience and decision-making capabilities within their software projects.
The Highcharts Dashboards 2.0 update brings significant advancements in customization and layout flexibility. With the introduction of 100% CSS styling, users now have complete control over the visual appearance of their dashboards and charts. This release also allows developers to construct their own HTML layouts, foregoing the default layout engine and leveraging custom HTML alongside the new CSS capabilities. This empowers users to tailor their dashboards to their unique use cases while retaining the robust data handling and synchronization functionality. Compatibility with CSS libraries like Tailwind and Bootstrap further enhances the customization possibilities without compromising on performance or functionality.
To see a full list of what's new in 2.0.0, see our release notes.
Highcharts Dashboards is licensed per developer as an Annual or Perpetual License with Internal, Saas, SaaS+ and OEM distribution options. The annual license includes support and all product updates for 1 year and must be renewed to continue to use the software. The perpetual license includes an "Advantage Subscription" for 1 to 5 years which provides support and updates for that period. If you do not renew Advantage then you may continue to use the software at the last release available during the active Advantage period. See our Highcharts Dashboards licensing page for full details.
Learn more on our Highcharts Dashboards product page.
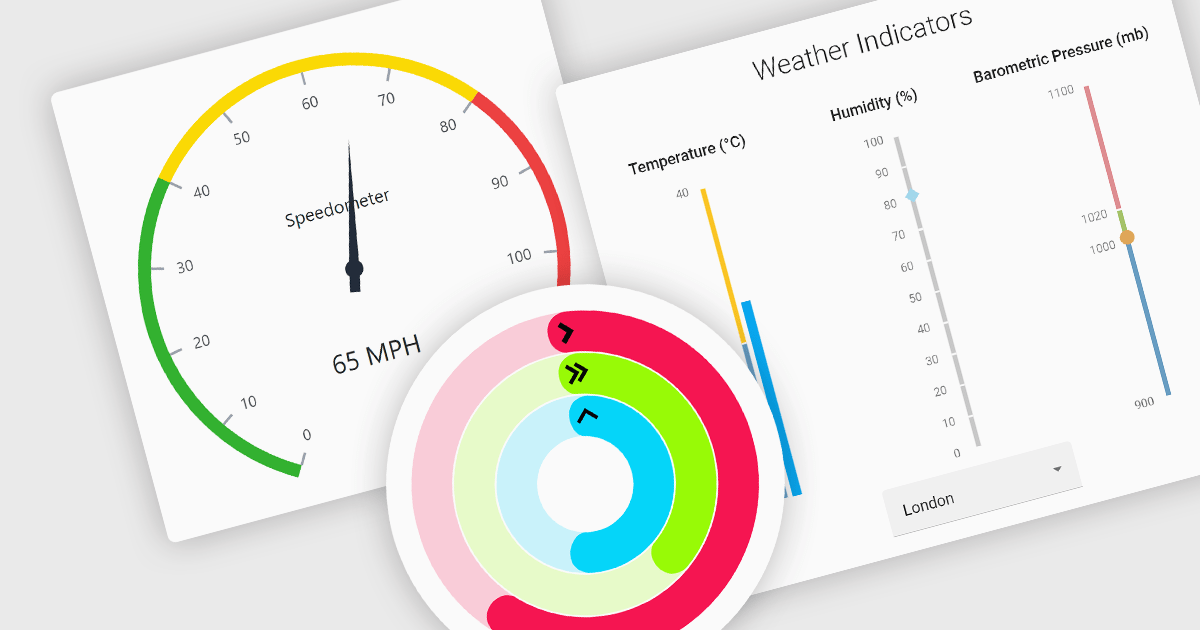
Gauge controls are visual tools used to display important metrics in an easily understood format, such as linear or radial layouts. These controls are ideal for dashboards and monitoring systems because they provide a clear snapshot of data in real-time, enhancing user decision-making and efficiency. Their simplicity and immediate data representation make them essential for applications where quick and accurate interpretations are crucial. Many gauges can be customized with various ranges, colors, and styles to effectively communicate data like speed, temperature, or progress, making them valuable tools for building informative user interfaces.
Several React UI suites feature a gauge component including:
For an in-depth analysis of features and price, visit our React UI Suites comparison.
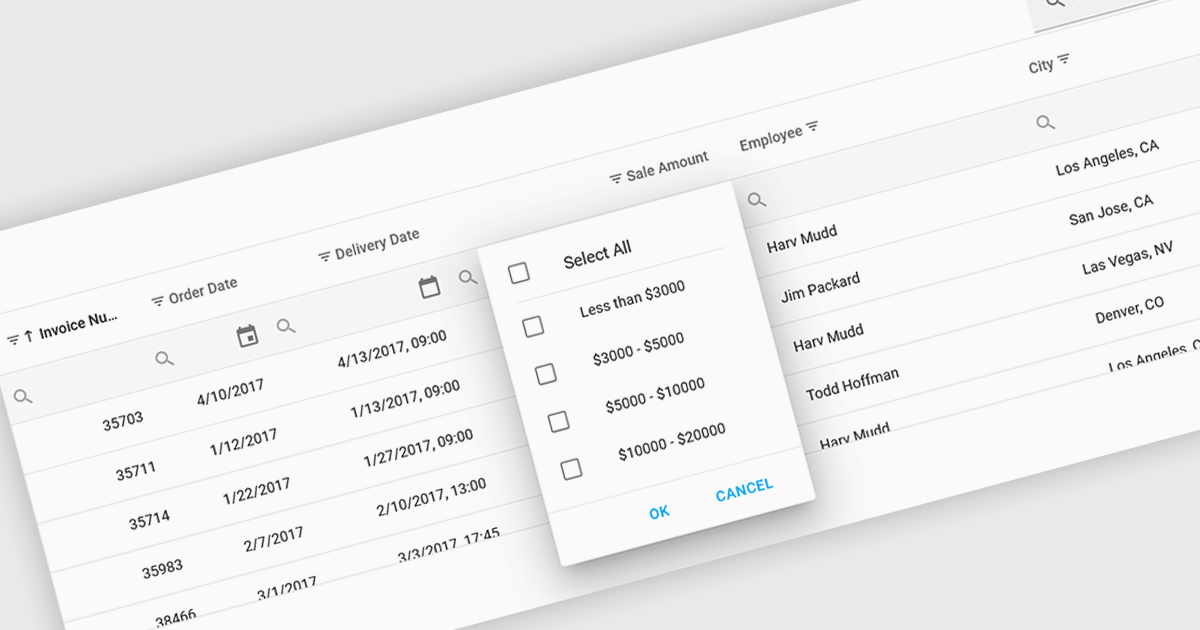
Using a grid control with support for filters enables users to dynamically narrow the displayed data based on specific criteria. This functionality helps users focus on relevant subsets of information by filtering individual columns using operators, keywords, or pre-defined options. Filtering improves data exploration efficiency and reduces cognitive load by presenting only the data that aligns with the user's current analysis.
Several React grid controls offer filtering functionality including:
For an in-depth analysis of features and price, visit our React Grid controls comparison.
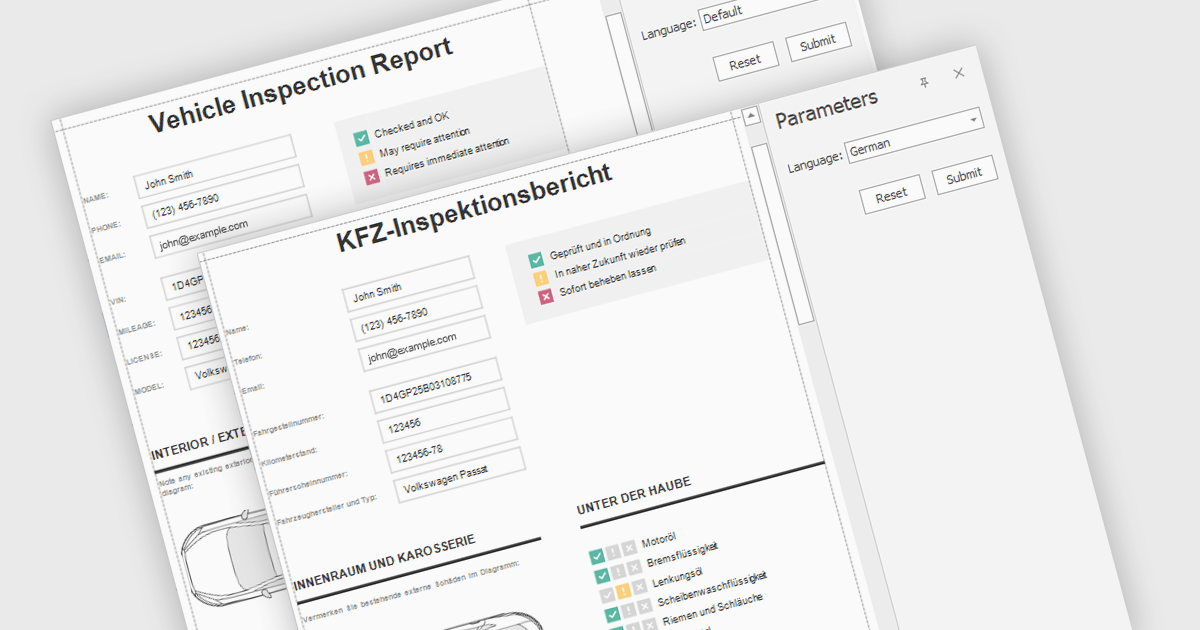
Report localization is the process of adapting a report for a target audience's language and cultural context. This involves translating text elements, formatting dates and currencies appropriately, and potentially adjusting the user interface to accommodate different reading habits such as right-to-left layouts. The goal is to ensure the report is clear, informative, and culturally sensitive for users worldwide.
Several React reporting controls offer localization including:
For an in-depth analysis of features and price, visit our React reporting controls comparison.
ONLYOFFICE Docs Enterprise Edition with Confluence Connector combines an online document editor with a seamless integration for Confluence, a centralized platform for project management and collaboration. This allows teams to create, view, edit, and collaborate on spreadsheets, presentations, and text files online, directly within Confluence, boosting efficiency and eliminating the need for file switching.
The ONLYOFFICE Confluence Connector v5.0.0 release (available as part of ONLYOFFICE Docs Enterprise Edition with Confluence Connector v8.0.1) adds functionality allowing you to create complex PDF forms with interactive fields and fill them out online, directly within your Confluence platform. This ability empowers teams to design and distribute easily fillable PDF forms seamlessly within Confluence, collecting valuable data from their users and fostering a more collaborative and productive work environment.
To see a full list of what's new in ONLYOFFICE Docs Enterprise Edition v8.0.1 with Confluence Connector 5.0.0, see our release notes.
ONLYOFFICE Docs Enterprise Edition with Confluence Connector is licensed per server and is available as an annual license with 1 year of support and updates, or as a perpetual license with 3 years of support and updates. See our ONLYOFFICE Confluence connector licensing page for full details.
For more information, see our ONLYOFFICE Confluence Connector product page.


Tel: (888) 850 9911
Fax: +1 770 250 6199


