


Official Supplier
As official and authorized distributors, we supply you with legitimate licenses directly from 200+ software publishers.
See all our Brands.
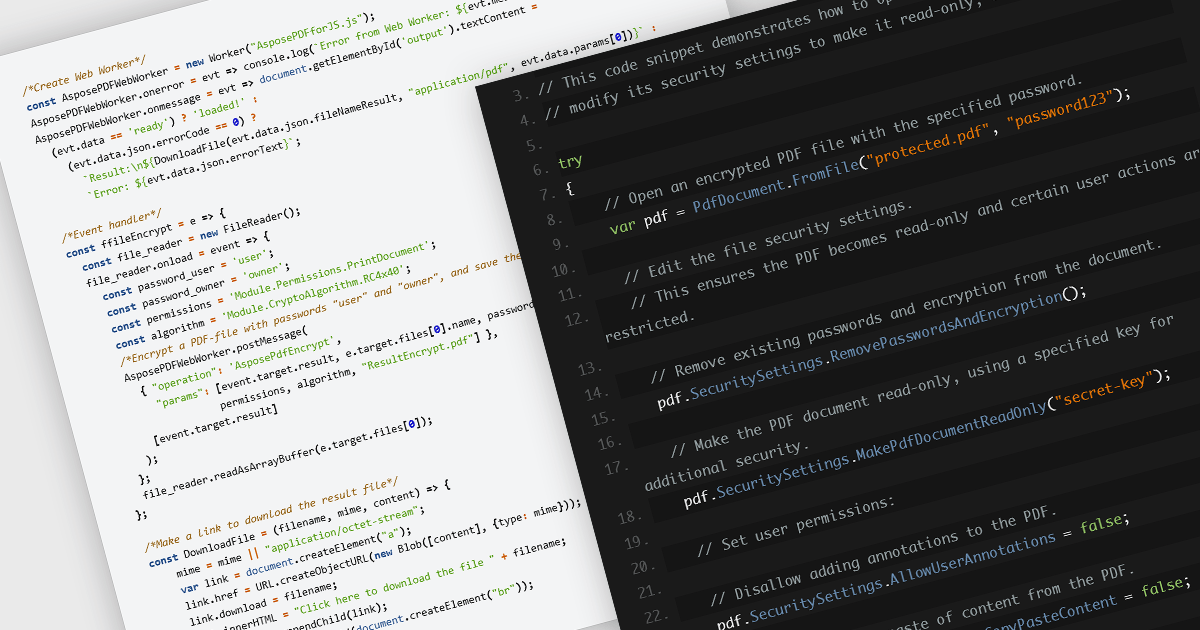
Encrypting and decrypting PDF files is a key feature in many modern PDF components, allowing developers to protect sensitive information and control access to documents. Encryption applies a security layer to the PDF, typically requiring a password to open or modify the file, while decryption reverses the process for authorized users. These capabilities are essential for applications that handle confidential business data, legal documents, or personal records, ensuring compliance with security policies and data protection regulations.
Several JavaScript PDF controls offer the ability to encrypt or decrypt PDF files including:
For an in-depth analysis of features and price, visit our JavaScript PDF controls comparison.
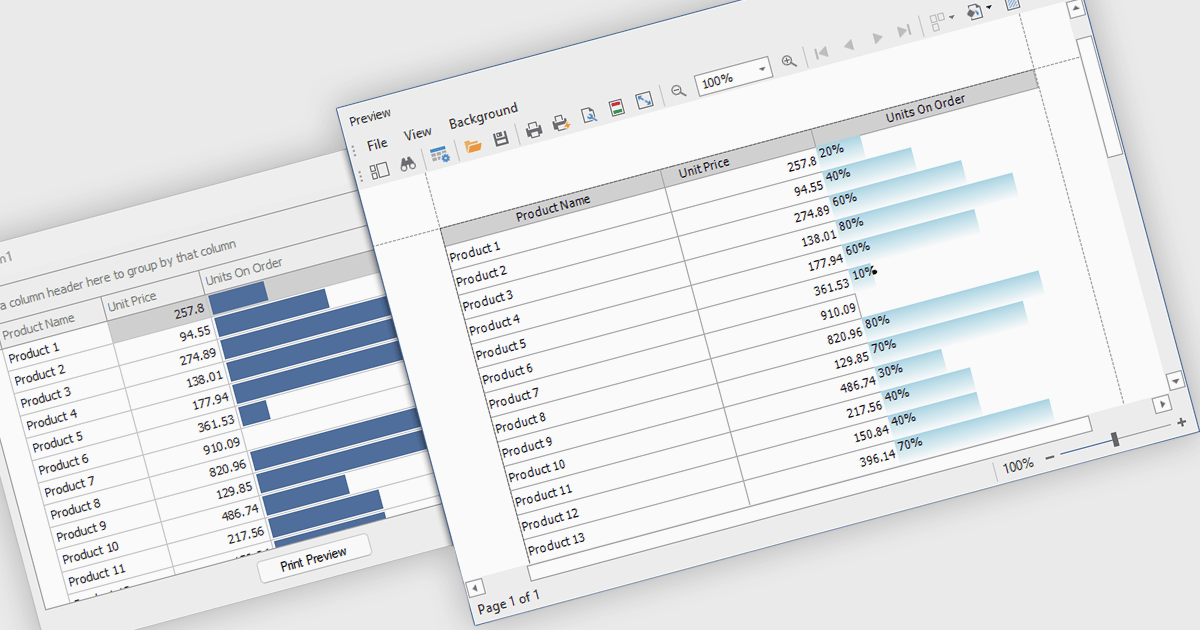
ProgressBar cell types in a .NET WinForms grid control are specialized cells that visually represent progress or completion levels within a grid layout, using horizontal progress bars. These cells are particularly useful for tracking status indicators, such as task completion or data processing percentages, directly within tabular views. They provide a clear, immediate representation of numeric progress values, enhancing readability without requiring users to interpret raw numbers. For developers, integrating ProgressBar cells simplifies the task of conveying progress-related information in data-driven interfaces, offering a familiar and consistent user experience aligned with standard Windows Forms controls.
Several .NET WinForms grid controls offer ProgressBar cell type controls, including:
For an in-depth analysis of features and price, visit our .NET WinForms grid controls comparison.
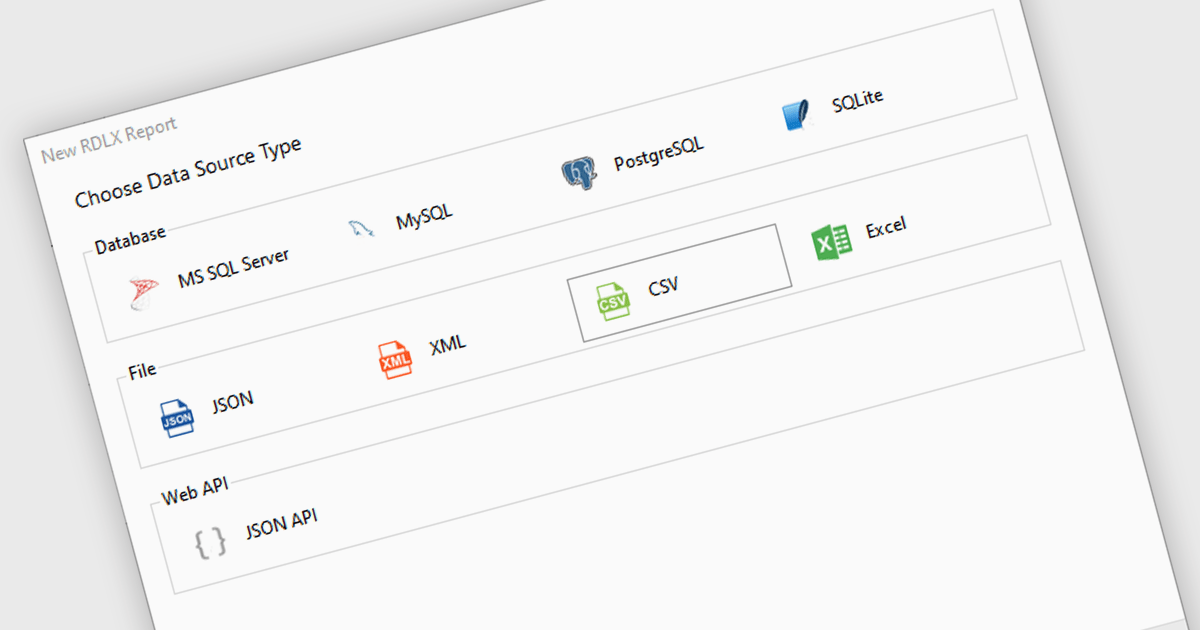
Excel / CSV data connectivity in a .NET 9 WPF reporting controls refers to the built-in capability to directly import and use data from Microsoft Excel spreadsheets or comma-separated value files as data sources for generating reports. This allows developers to integrate reporting functionality into their desktop applications without needing intermediate data transformations or external database connections. It simplifies the development workflow by supporting widely used formats, ensures compatibility with existing business data, and reduces the need for additional parsing or data handling logic. The result is faster report generation and easier access to commonly used data formats.
Several .NET 9 WPF reporting controls offer Excel / CSV data connectivity including:
For an in-depth analysis of features and price, visit our comparison of .NET 9 WPF reporting controls.
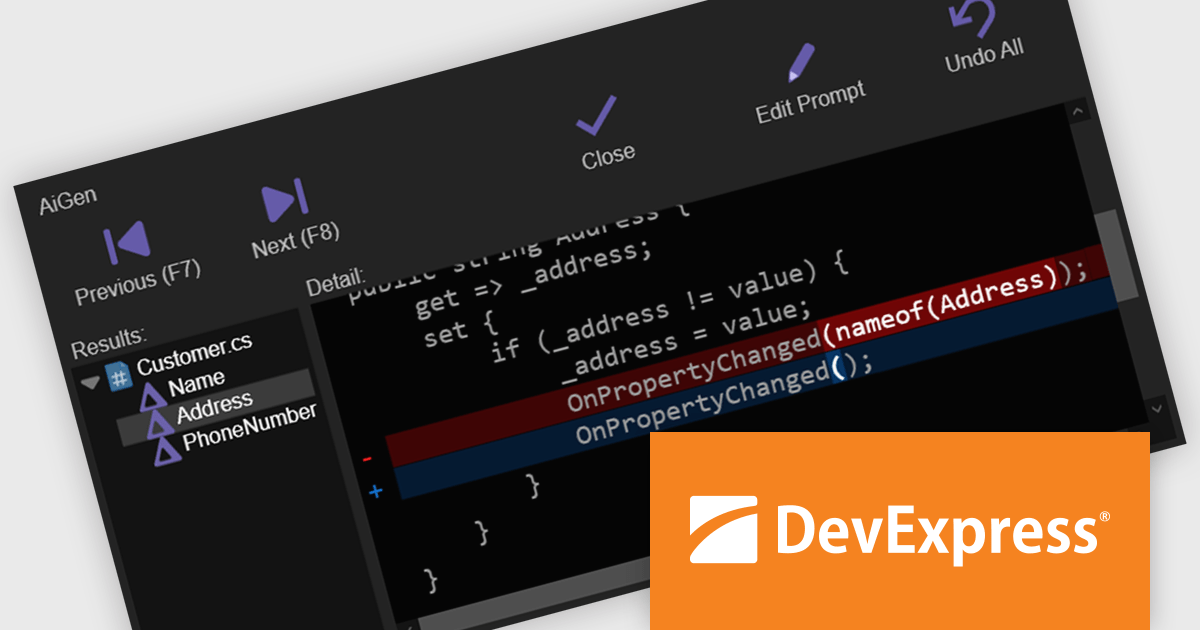
CodeRush Ultimate is a Visual Studio extension designed to improve developer productivity and creativity. It empowers you to generate sophisticated code, automate tedious tasks, and navigate your codebase effortlessly, all while boosting code quality and readability. By eliminating repetitive coding and providing intelligent assistance, CodeRush Ultimate frees you to focus on the big picture, helping you deliver more features faster and with higher quality.
The CodeRush Ultimate 25.1 update adds AiGen - an integrated AI tool that allows developers to generate, refactor, and update code using everyday language. By embedding this functionality directly within CodeRush and Visual Studio, AiGen offers immediate, context-aware code suggestions without the need for external tools or services. This update is designed to improve productivity and reduce development time, while keeping everything inside the familiar confines of your existing development environment.
To see a full list of what's new in version CodeRush Ultimate 25.1, see our release notes.
CodeRush Ultimate is licensed per developer and is available as a Perpetual License with a 12 month support and maintenance subscription. See our CodeRush Ultimate licensing page for full details.
CodeRush Ultimate is available to buy in the following products:
Spread.NET by MESCIUS is a powerful tool for building Excel-like applications in your .NET projects. It lets you create interactive spreadsheets, grids, dashboards, and even forms within WinForms, ASP.NET, and WPF applications. With its rich feature set, including a robust calculation engine, formula support, and Excel compatibility, Spread.NET empowers developers to build data analysis tools, budgeting apps, scientific dashboards, and more, all within the familiar .NET environment.
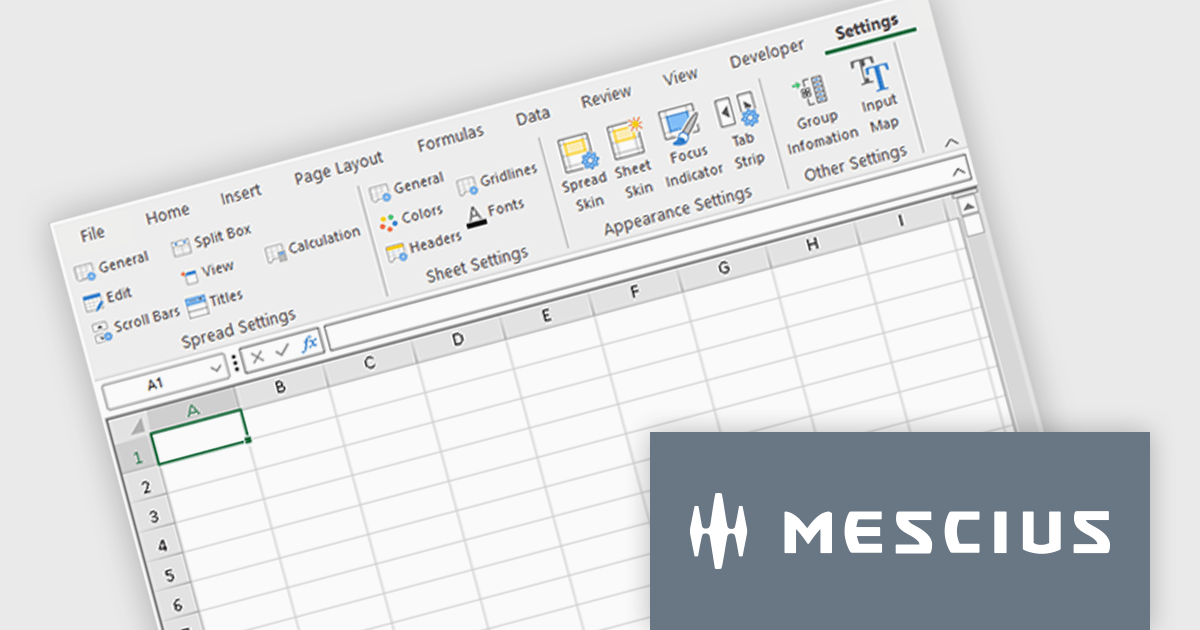
The Spread.NET 18.2 update refines the RibbonBar in WinForms to improve the efficiency and clarity of UI design during development. With expanded icon visibility, developers can more easily access and identify commands, reducing visual ambiguity and speeding up layout tasks. The addition of new layout options for the collapsed state offers greater control over how the RibbonBar adapts to different form sizes, enabling more responsive and space-efficient interface designs. These improvements help streamline the design-time experience, allowing developers to build cleaner, more functional applications with less manual configuration.
To see a full list of what's new in v18.2, see our release notes.
Spread.NET is licensed per developer and is available as a Perpetual License with a 12 month support and maintenance subscription. We can supply any Spread.NET license including new licenses, maintenance renewals, and upgrade licenses. See our Spread.NET licensing page for full details.
For more information, visit our Spread.NET product page.


Tel: (888) 850 9911
Fax: +1 770 250 6199


