


Official Supplier
As official and authorized distributors, we supply you with legitimate licenses directly from 200+ software publishers.
See all our Brands.
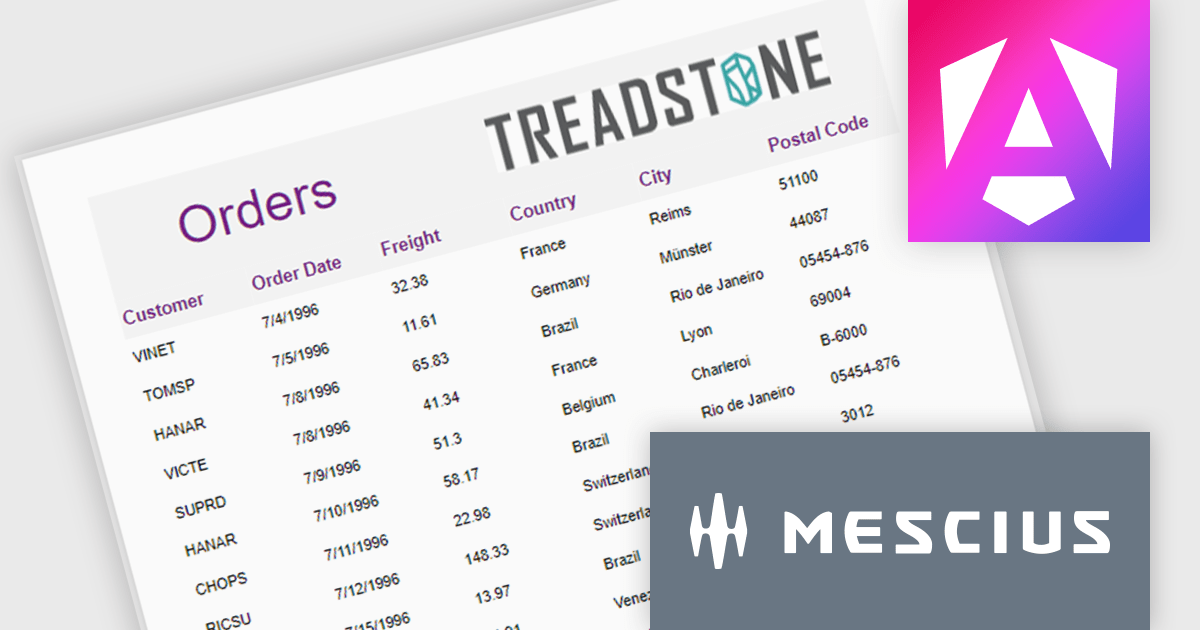
ActiveReportsJS is a robust JavaScript reporting tool that enables developers and report authors to seamlessly design and integrate interactive reports into web applications. It offers advanced features such as drill-down capabilities, runtime data filtering, and interactive parameters, enhancing the functionality and usability of reports. With compatibility across popular frameworks and the flexibility of its report designer component, ActiveReportsJS simplifies the visualization of diverse data sets, making it ideal for applications that require financial reporting, such as balance sheets, and other dynamic reporting needs.
In this blog post, MESCIUS Product Manager Joel Parks highlights real-world scenarios in where you can use ActiveReportsJS to provide users with the capability to define data sources on the fly, using Runtime Data Binding to dynamically inject data into your Angular Reporting component at runtime. Steps include:
This powerful capability gives your application the flexibility to generate customized reports based on user input, server logic, or changing data sources, without forcing the report designer to predefine every field.
Read the full blog to get started building powerful, dynamic reports.
ActiveReportsJS is licensed on an annual subscription or perpetual basis and is available as a Single Deployment License for non-commercial use, and as a Single Domain License or Unlimited Domain License for commercial and/or SaaS use. See our ActiveReportsJS licensing page for full details.
For more information, visit our ActiveReportsJS product page.
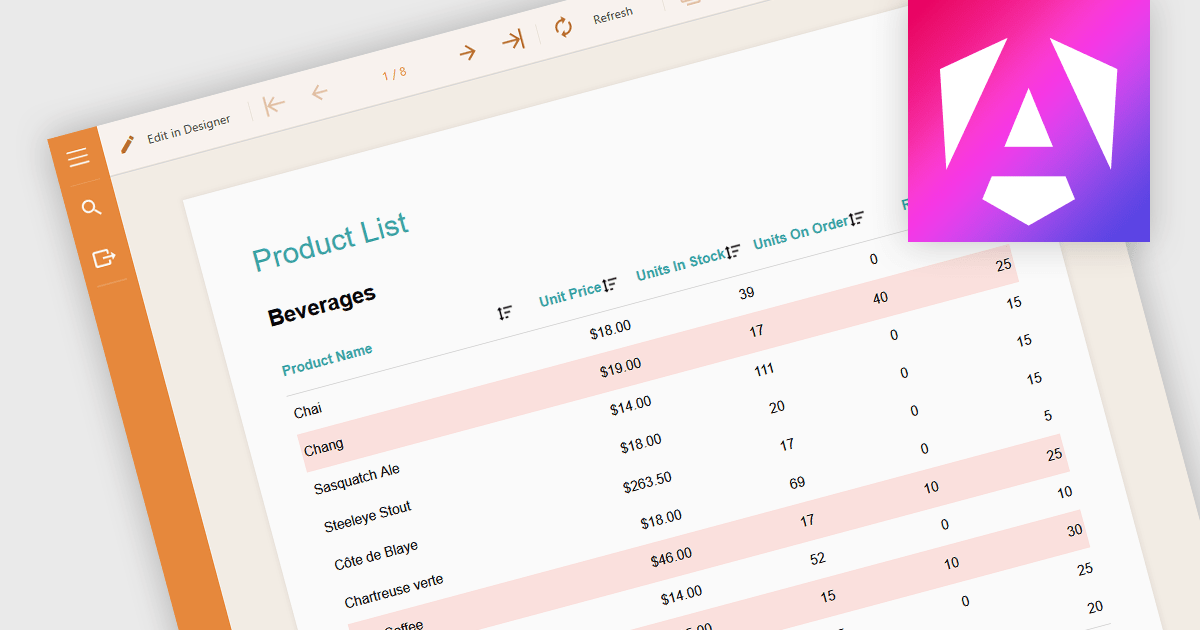
Conditional formatting in a report is a feature that automatically applies visual styles, such as font or background color, to the content within the report based on logical conditions or the data values themselves. This technique allows users to highlight trends, anomalies, or key thresholds by dynamically adjusting the appearance of report elements according to predefined rules, which is especially useful in performance monitoring or exception tracking scenarios. It improves the readability of data-heavy reports by making important information stand out, helping users quickly identify patterns, exceptions, or performance issues. For developers and analysts, it provides a practical way to make complex datasets easier to interpret without manual intervention.
Several Angular reporting components allow you to apply conditional formatting, including:
For an in-depth analysis of features and price, visit our comparison of Angular reporting components.
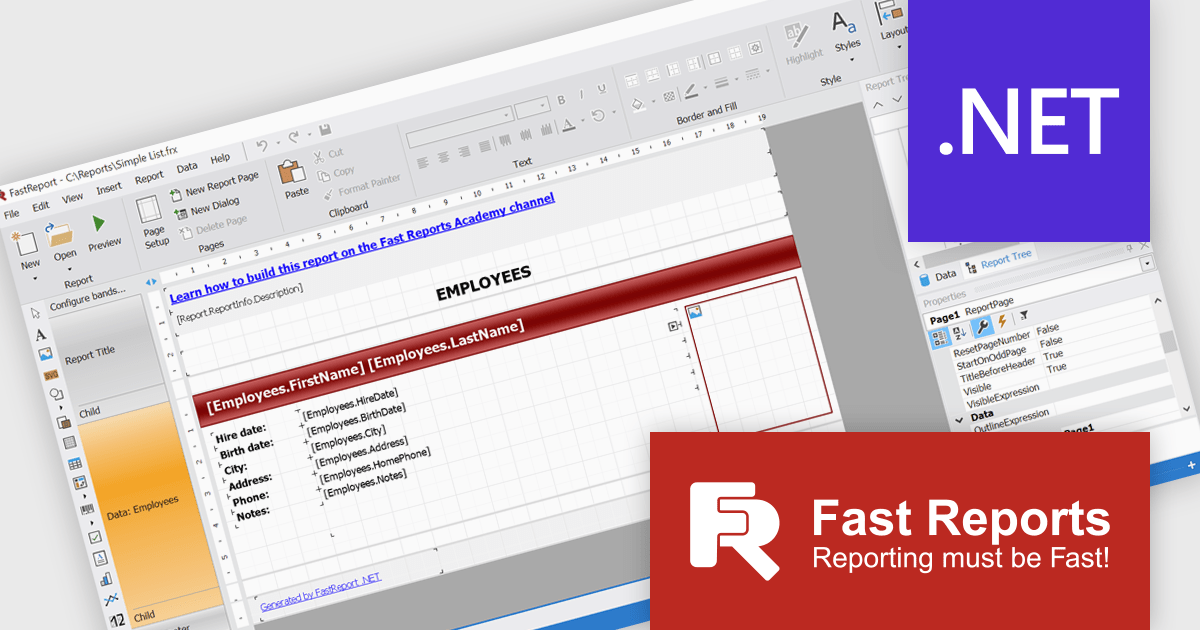
FastReport .NET Ultimate is a comprehensive reporting solution for developers working within the Microsoft .NET ecosystem. It supports the creation, design, and delivery of rich, interactive reports across Windows Forms, ASP.NET, MVC, and .NET Core applications. The Ultimate edition includes server deployment capabilities and extensive export options, such as PDF, Excel, Word, and HTML. It connects to various data sources, including SQL databases and business objects, providing flexibility for enterprise-level reporting. With the integrated FastReport Online Designer, users can edit reports directly in their browsers, enabling efficient collaboration and modern, full-featured report design across both desktop and web platforms.
The FastReport .NET Ultimate 2026.1 update introduces an improved Ribbon interface and a new 'RibbonDesignerControl', giving developers a more intuitive and efficient report design experience. The redesigned Ribbon UI offers a cleaner, more structured layout that simplifies access to tools and settings, improving usability and reducing development time. This addition allows developers to integrate the same modern Ribbon interface directly into their own applications, providing a consistent and familiar design environment for end users. This enhancement supports smoother workflows, greater customization, and a more professional user experience across both desktop and web reporting solutions.
To see a full list of what's new in version 2026.1, see our release notes.
FastReport .NET Ultimate is licensed per named user and is available as a perpetual license with a one-year subscription for updates and support. See our FastReport .NET Ultimate licensing page for full details.
For more information, visit our FastReport .NET Ultimate product page.
Stimulsoft BI Designer is a powerful reporting tool designed to create visually appealing and interactive reports. It allows users to design and develop complex reports with ease, integrating data from various sources and presenting it in a clear, concise, and informative manner. With its rich feature set, Stimulsoft BI Designer is widely used in diverse industries, including finance, healthcare, retail, and manufacturing, to generate reports for analysis, decision-making, and compliance purposes. Key benefits include its intuitive interface, extensive customization options, and support for multiple data sources, making it an essential tool for organizations seeking to enhance their reporting capabilities and gain valuable insights.
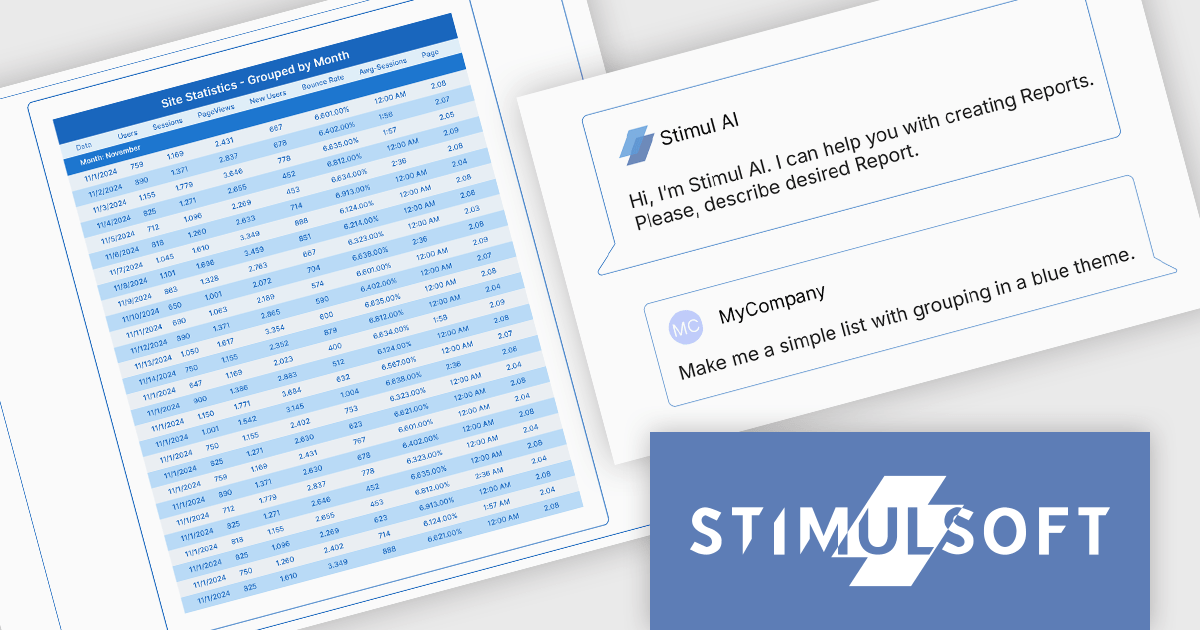
The Stimulsoft BI Designer 2025.4.1 update introduces an AI-powered Report Wizard that improves the report creation process for developers by transforming plain text queries into fully structured reports. It supports various report types, including simple lists, grouped, master-detail, and column-based formats, automatically analyzing connected data sources to generate accurate layouts. Developers can further refine and adjust report designs through custom queries, enabling efficient customization without manual configuration. This feature significantly reduces development time and enhances productivity within the Stimulsoft BI Designer environment.
To see a full list of what's new in 2025.4.1, see our release notes.
Stimulsoft BI Designer is available as a perpetual license and is licensed per creator. A creator is a person who creates reports, dashboards, or forms in a standalone (desktop) designer or online designer. The creator may install one copy of the standalone (desktop) designer. See our Stimulsoft BI Designer licensing page for full details.
Stimulsoft BI Designer is available individually or as part of Stimulsoft Ultimate.
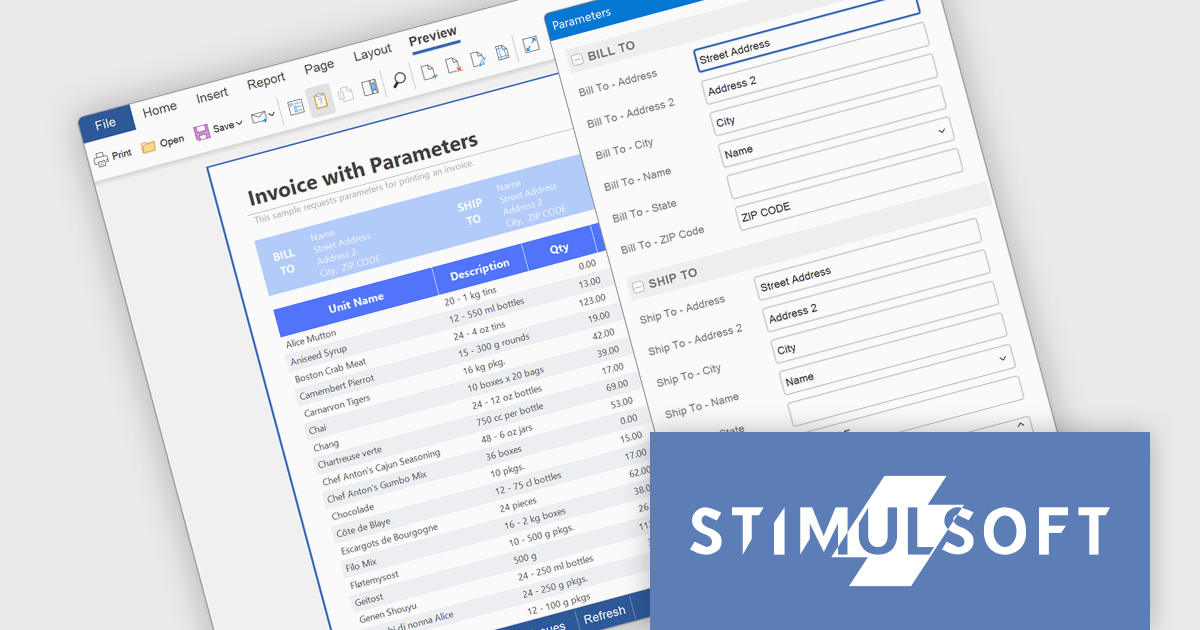
Stimulsoft BI Cloud is a cloud-based business intelligence platform that allows organizations to create, manage, and share interactive dashboards and reports. By offering a user-friendly interface and a wide range of data visualization tools, Stimulsoft BI Cloud enables users to gain valuable insights from their data, make informed decisions, and improve overall business performance.
The Stimulsoft BI Cloud 2025.4.1 update introduces a new Parameters dialog that enhances control and flexibility when generating reports and dashboards. By displaying parameters in a dedicated dialog window, developers can ensure users review and confirm their input values before report execution. This approach prevents unnecessary data loading, maintains dashboard visibility during parameter entry, and supports a more structured and efficient workflow for report generation and testing.
To see a full list of what's new in 2025.4.1, see our release notes.
Stimulsoft BI Cloud is available as a perpetual license and is licensed per creator. A creator has an account on the server, has access from the client-side, registered as an editor, and uses the product to work with report templates and dashboards - create, edit, view, delete, etc. See our Stimulsoft BI Designer licensing page for full details.
Stimulsoft BI Cloud is available individually or as part of Stimulsoft Ultimate.


Tel: (888) 850 9911
Fax: +1 770 250 6199


