


Official Supplier
As official and authorized distributors, we supply you with legitimate licenses directly from 200+ software publishers.
See all our Brands.
Reporting themes refers to applying consistent visual styles such as colors, fonts, and layouts across report elements to match an application's design and branding. This ensures a cohesive user experience, simplifies development through centralized style management, and supports dynamic customization such as light or dark mode. Common use cases include branded dashboards, client-specific report styling, and consistent visuals in multi-tenant SaaS platforms.
Several ASP.NET Core reporting controls offer support for themes including:
For an in-depth analysis of features and price, visit our ASP.NET Core reporting controls comparison.
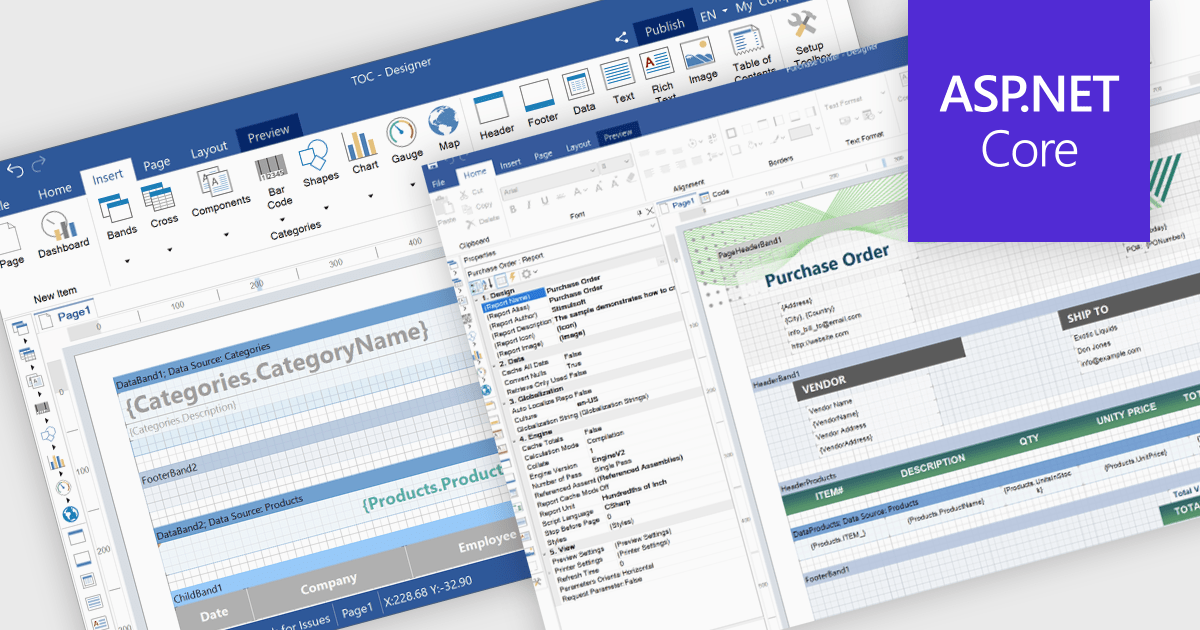
Stimulsoft Reports.WEB is a cross-platform reporting solution designed for integration within web applications. It leverages a client-server architecture for report generation, viewing, printing, and exporting directly in web browsers. Its powerful .NET report engine offers efficient report processing, a user-friendly HTML5 report designer for building reports with various data sources and visualizations, and an interactive HTML5 viewer for seamless report display within web applications. This integration allows developers to implement robust reporting functionalities without browser plugins or additional client-side dependencies.
The Stimulsoft Reports.WEB 2025.3.1 update introduces a new Report tab that improves the efficiency of report design by centralizing essential configuration tools within a single, accessible workspace. This tab integrates key functions such as Report Options, Preview Settings, Export Settings, and Globalization, allowing developers to manage the core aspects of their report templates without switching between multiple panels or views. By streamlining access to these commonly used features, the update enhances workflow speed, reduces setup complexity, and supports more consistent report output across different environments.
To see a full list of what's new in 2025.3.1, see our release notes.
Stimulsoft Reports.WEB is licensed per developer and is available as a perpetual license with 1 year support and maintenance. See our Stimulsoft Reports.WEB licensing page for full details.
Stimulsoft Reports.WEB is available individually or as part of Stimulsoft Ultimate.
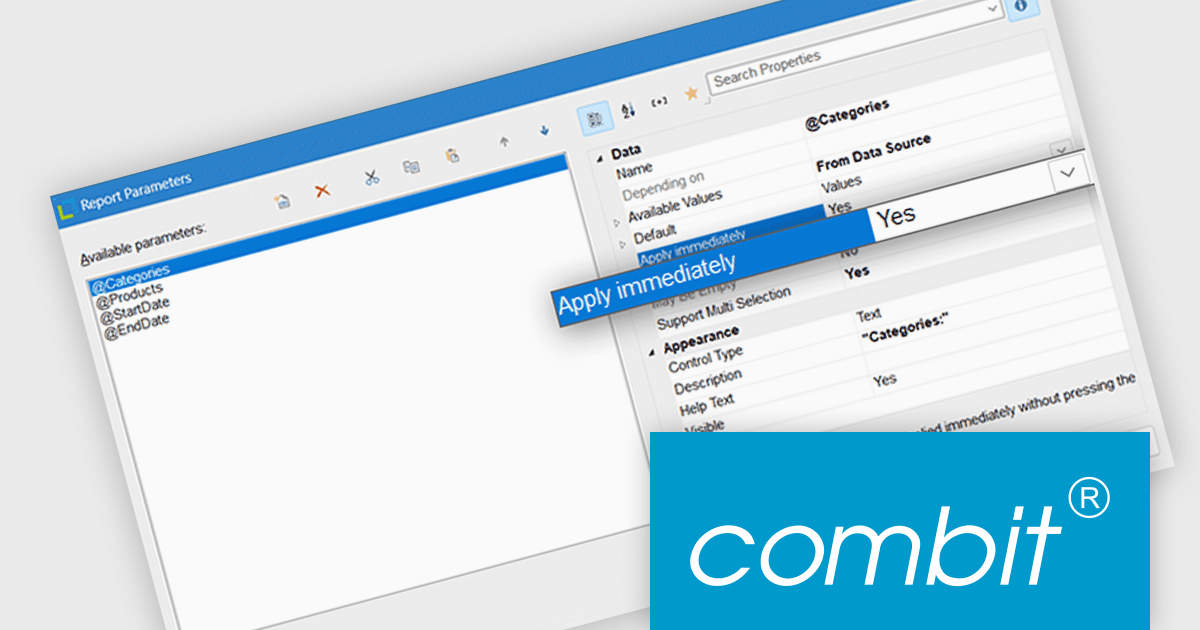
List & Label by combit is a software development toolkit that empowers developers to integrate comprehensive reporting functionalities into their desktop, web, and cloud applications. It offers features such as data binding, complex data visualization, and a user-friendly report designer, along with printing, exporting, and previewing capabilities. List & Label operates independently of programming languages and data sources, providing developers with the flexibility to design and deliver informative reports within their development environment.
List & Label now includes an "Apply immediately" property for report parameters, which when set, automatically re-renders the report immediately after the property in question is changed. This feature removes the need to manually refresh the report when updating the parameters, making it particularly useful in interactive reporting scenarios where users need to see updated results as they adjust filters or settings in real time.
List & Label is licensed per developer and is available as a Perpetual License with a 12 month support and maintenance subscription. See our List & Label licensing page for full details.
List & Label is available in the following products:
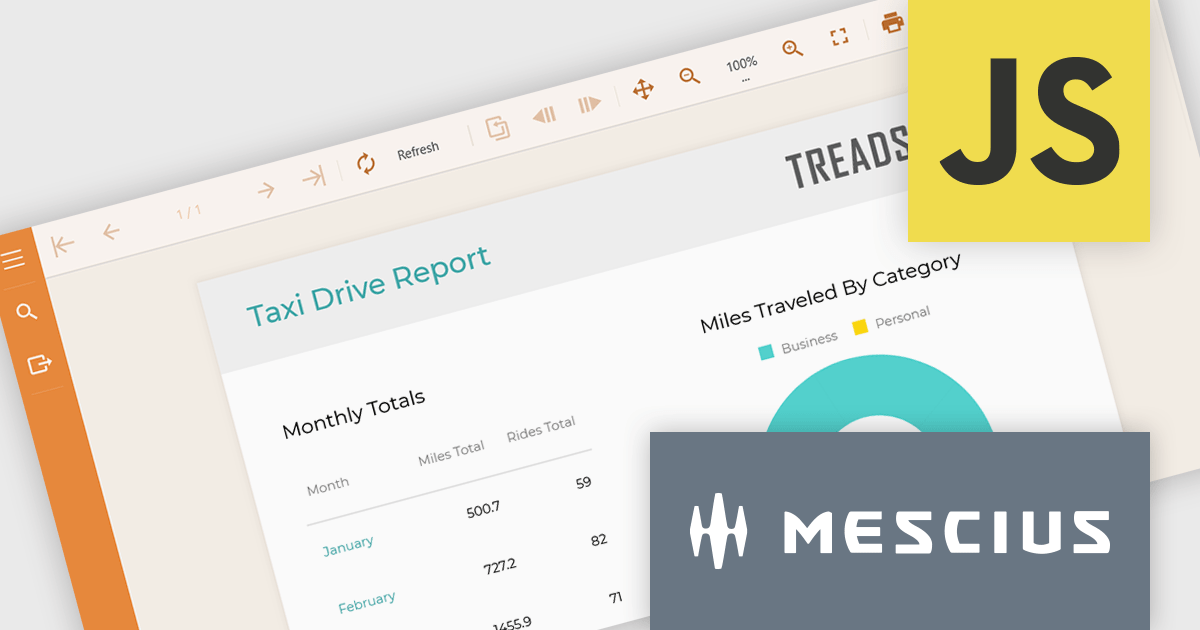
ActiveReportsJS is a powerful, lightweight reporting tool designed to seamlessly integrate advanced reporting capabilities into any JavaScript application. ActiveReportsJS enables developers to create, view, export, and print richly formatted reports entirely on the client side - with zero server dependencies.
On July 24, 2025 at 11:00 AM EDT, MESCIUS (formerly GrapeCity) will be presenting a CodeClinic Live Webinar to demonstrate how you can include the ActiveReportsJS Report Viewer and Report Designer in your application. From implementing the controls to a step-by-step process on how to build reports, by the end, you'll have all of the tools needed to incorporate an advanced reporting solution in your web applications.
Register for the LIVE webinar today, and mark your calendar for July 24.
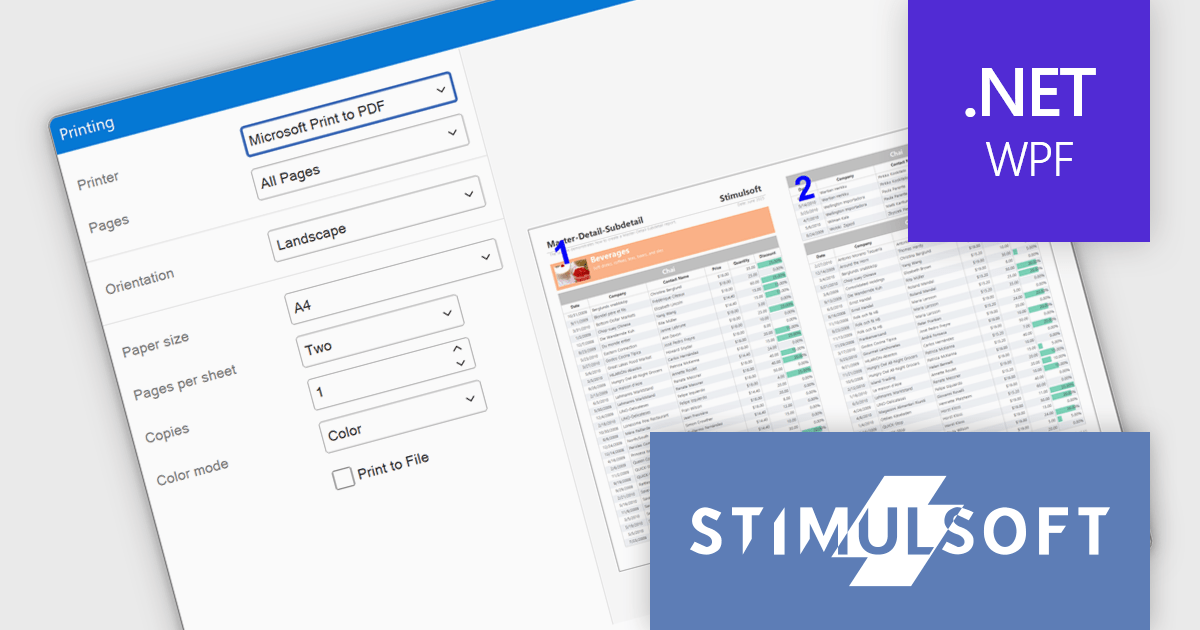
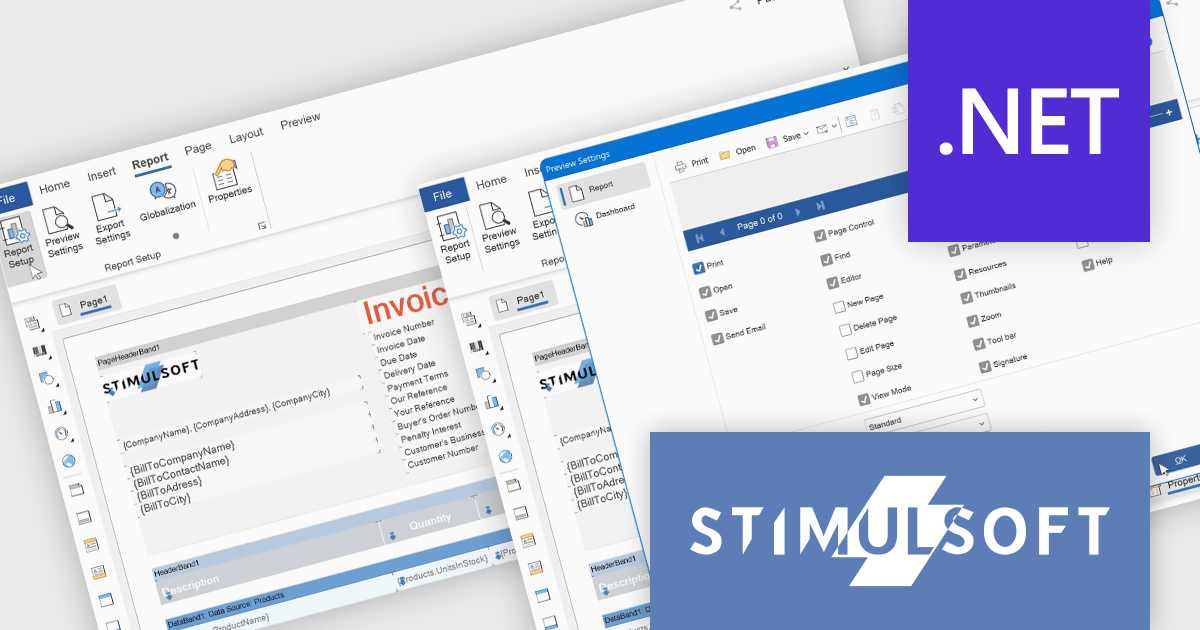
Stimulsoft Reports.WPF is a powerful reporting component for Windows Presentation Foundation (WPF) that provides rich rendering, viewing, printing, and exporting capabilities, allowing users to easily create, customize, and execute complex reports with minimal code, featuring a designer, data binding, WYSIWYG printing, and support for multiple export formats.
The Stimulsoft Reports.WPF 2025.3.1 update introduces a new Extended Print Dialog that enhances the printing experience by offering a customizable print window with built-in report preview. This allows developers to provide users with a clearer view of report layout and formatting before printing, while automatically adjusting available print options based on the installed printer driver. The feature is easy to enable and helps ensure more accurate, efficient, and user-friendly report output.
To see a full list of what's new in 2025.3.1, see our release notes.
Stimulsoft Reports.WPF is licensed per developer and is available as a perpetual license with 1 year support and maintenance. See our Stimulsoft Reports.WPF licensing page for full details.
Stimulsoft Reports.WPF is available in the following products:


Tel: (888) 850 9911
Fax: +1 770 250 6199


