


Official Supplier
As official and authorized distributors, we supply you with legitimate licenses directly from 200+ software publishers.
See all our Brands.
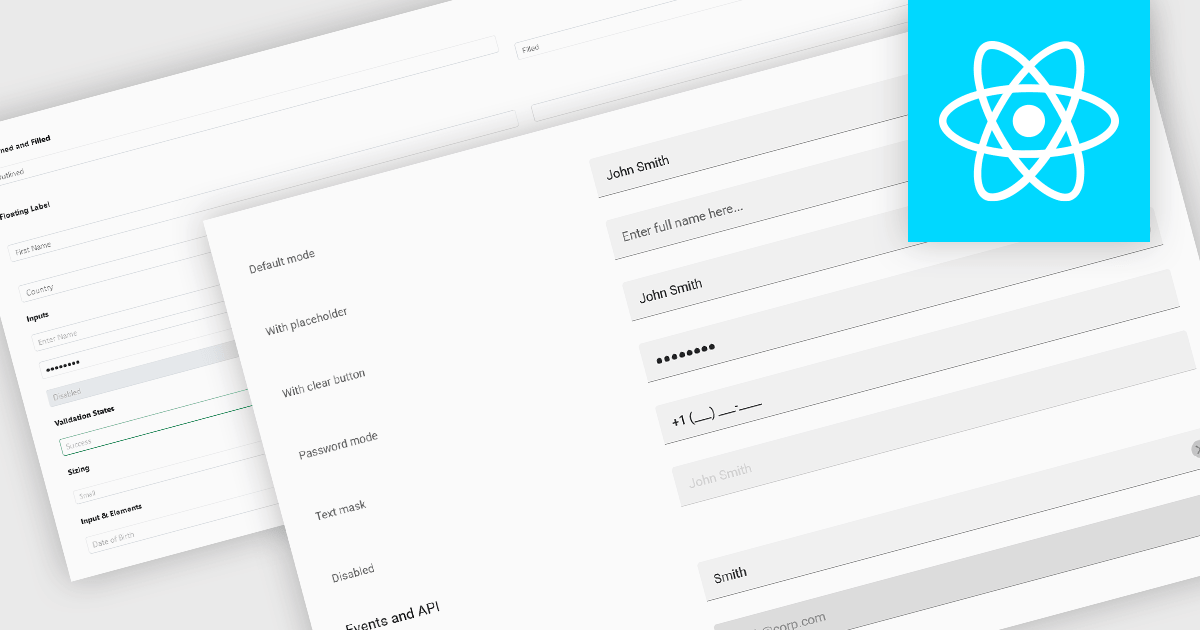
Text Box components in React Data Editors are interactive controls that allow users to input, edit, and manage textual data within a web interface. Designed to handle everything from single-line entries like names and titles to multi-line content such as comments or descriptions, these components are a core part of form-driven applications. They often include features like placeholder text, character limits, validation hooks, and integration with state management tools, which help ensure data quality and user-friendly interactions. Text Boxes are widely used in settings such as user registration forms, feedback systems, and content management interfaces, where accurate and flexible text input is essential to the application's functionality.
Several React data editor collections offer text box components including:
For an in-depth analysis of features and price, visit our React data editors comparison.
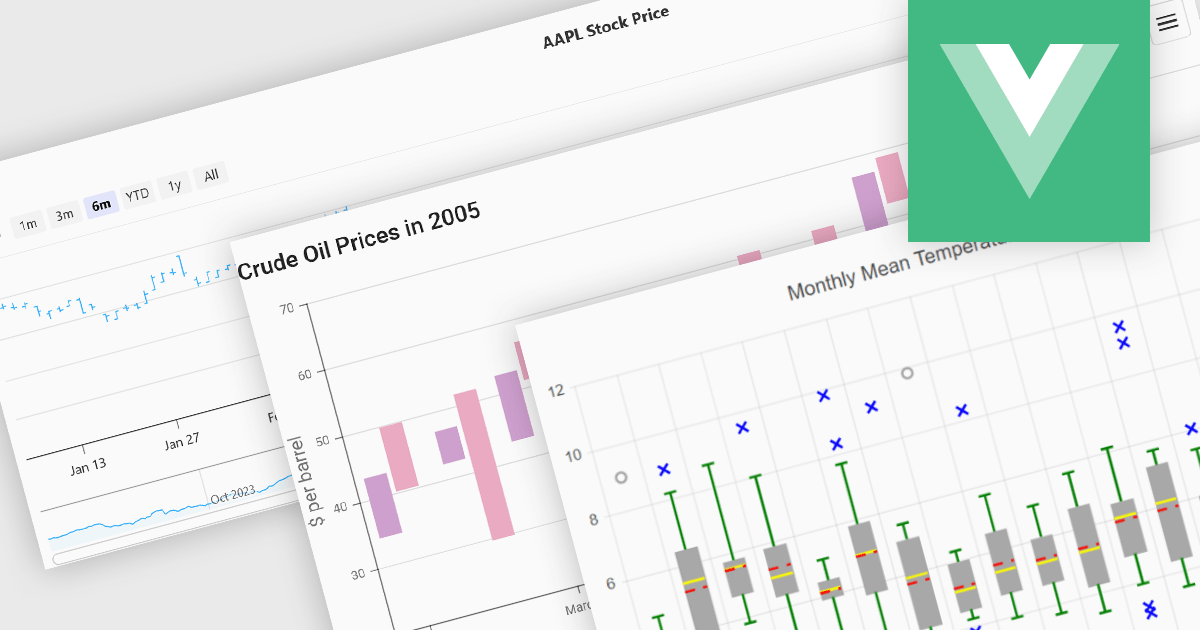
Financial chart components are used within software applications to visually represent complex financial data over time. They enable users, particularly those in trading, investment, and financial analysis, to interpret trends, compare performance, and make data-driven decisions more effectively. These components typically support a variety of chart types tailored to the unique requirements of financial datasets, allowing for granular analysis of price movements, market trends, and volatility.
Common features include:
For an in-depth analysis of features and price, visit our Vue.js Chart components comparison.

GitKraken is a suite of developer tools built around Git, a popular version control system. It offers a graphical user interface (GUI) that allows developers to interact with Git repositories visually instead of relying on the command line. This simplifies complex Git workflows like resolving merge conflicts and visualizing code history, making Git more accessible and efficient for developers of all experience levels.
The GitLens for VS Code V17.2 release (included in GitKraken) adds new AI commands (in preview) which can generate and rebase commits from working tree changes or from commits in an existing branch. With the Generate Commits with AI command, developers can now convert their uncommitted working tree changes into a series of meaningful, structured commits using AI. This reduces the need for manual staging and commit composition, helping developers maintain cleaner commit histories with better documentation. The new Rebase with AI feature enables developers to take existing commits from a branch and rework them into a fresh, AI-organized commit history on a new branch. This is particularly useful for cleaning up commit history before merging or sharing code, ensuring that changes are logically grouped and well-explained. Each generated commit is accompanied by a document explaining what was changed and why, offering transparency and traceability. For added safety, GitLens includes messaging to guide first-time users and an Undo option that attempts to revert the AI-generated changes, making the feature approachable and reversible.
To see a full list of what's new in V17.2, see our release notes.
GitLens for VS Code is part of GitKraken which is available as Cloud-based or On-Premise options, licensed per user as an annual license which includes free updates and technical support. See our GitKraken licensing page for full details.
Learn more on our GitKraken product page.
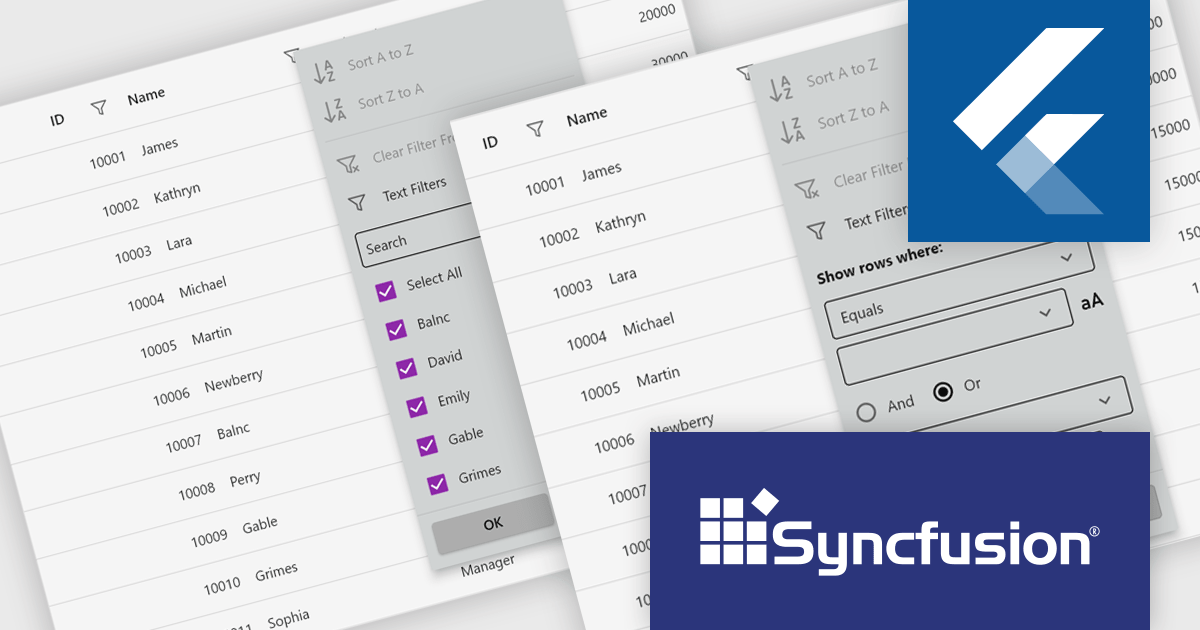
Syncfusion Essential Studio Flutter (available as part of Syncfusion Essential Studio Enterprise) is a powerful UI toolkit that enables you to build beautiful and performant mobile apps for Android and iOS using Flutter. It provides a rich suite of pre-built widgets for common design elements like charts, data grids, calendars, and PDF viewers. These widgets are highly customizable and allow you to quickly implement stunning visuals and advanced functionalities without spending time on repetitive coding.
The Syncfusion Essential Studio Flutter 2025 Volume 2 update introduces filter pop-up appearance customization in the DataGrid, giving developers greater control over the visual design of filter interfaces. This enhancement allows for precise styling of built-in widgets within both checkbox and advanced filter pop-up menus, enabling seamless alignment with application design systems. By tailoring the look and feel of these components, developers can deliver a more consistent and intuitive user experience across data filtering workflows.
To see a full list of what's new in 2025 Volume 2 (30.1.37), see our release notes.
Syncfusion Essential Studio Flutter is available as part of Syncfusion Essential Studio Enterprise which is licensed per developer starting with a Team License of up to five developers. It is available as a 12 Month Timed Subscription License which includes support and maintenance. See our Syncfusion Essential Studio Enterprise licensing page for full details.
Learn more on our Syncfusion Essential Studio Flutter product page.
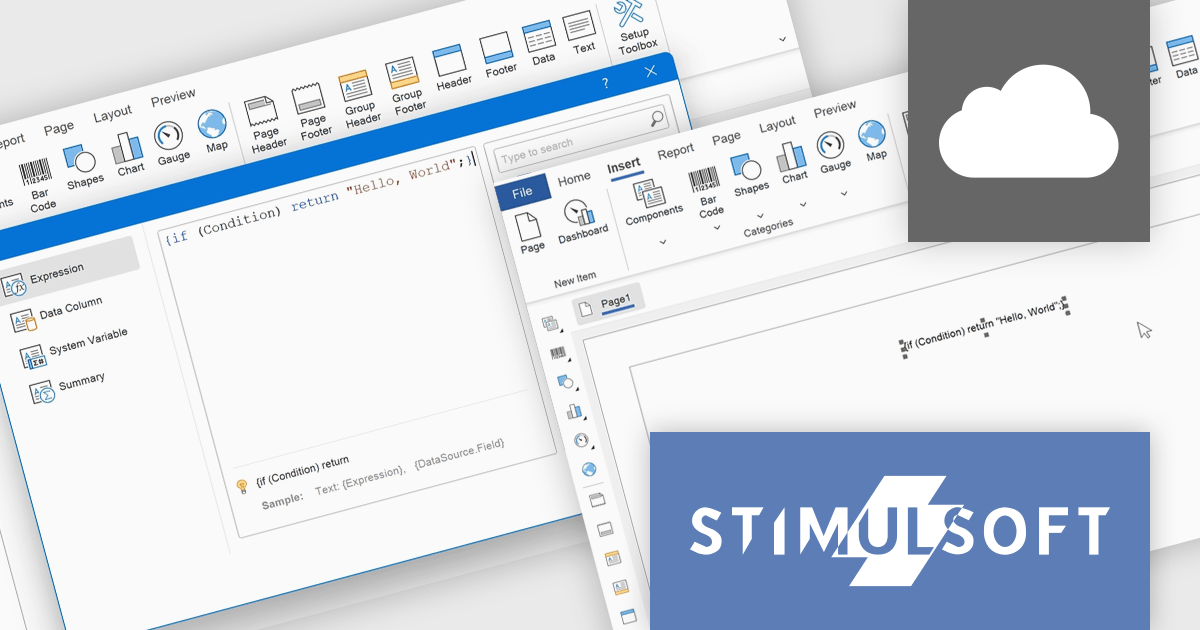
Stimulsoft BI Cloud is a cloud-based business intelligence platform that allows organizations to create, manage, and share interactive dashboards and reports. By offering a user-friendly interface and a wide range of data visualization tools, Stimulsoft BI Cloud enables users to gain valuable insights from their data, make informed decisions, and improve overall business performance.
The Stimulsoft BI Cloud v2025.3.1 update introduces support for executing C# scripts in Interpretation Mode, allowing developers to implement custom logic directly within reports using standard C# constructs such as conditions, loops, and user-defined functions. This enhancement enables dynamic data handling across events, expressions, and functions without the need for pre-compilation, improving report customization and development efficiency. Developers can reference report variables, data columns, and built-in functions within scripts, while also maintaining control through configurable execution settings, including script timeouts and permissions at both report and global levels.
To see a full list of what's new in 2025.3.1, see our release notes.
Stimulsoft BI Cloud is available as an annual license and is licensed per creator. A creator has an account on the server, has access from the client-side, registered as an editor, and uses the product to work with report templates and dashboards - create, edit, view, delete, etc. See our Stimulsoft BI Cloud licensing page for full details.
Stimulsoft BI Cloud is available in the following products:


Tel: (888) 850 9911
Fax: +1 770 250 6199


