


Official Supplier
As official and authorized distributors, we supply you with legitimate licenses directly from 200+ software publishers.
See all our Brands.
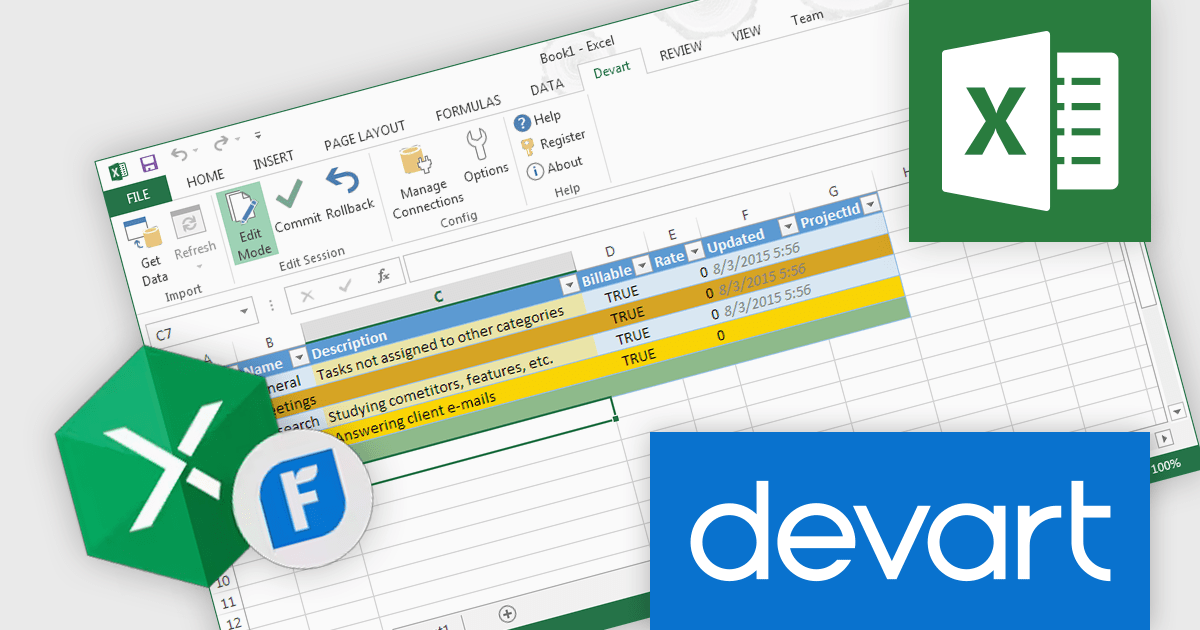
Devart Excel Add-in for FreshBooks is a powerful tool that seamlessly integrates Excel with the FreshBooks accounting software. It enables users to directly import and export data between the two platforms, automating tasks such as creating invoices, tracking expenses, and managing client information. This integration streamlines workflows, eliminates manual data entry, and ensures accuracy and efficiency in financial management.
The Devart Excel Add-in for FreshBooks 2.10.1404 release adds the BillVendor, Bill, BillLine, and BillPayment tables. This significantly enhances the granularity and flexibility of financial data management. These tables enable detailed tracking of vendor information, invoice details, line items, and payment history. This structured approach facilitates accurate reporting, analysis, and compliance with financial regulations. By breaking down financial transactions into distinct components, organizations can gain deeper insights into their spending patterns, identify cost-saving opportunities, and maintain better control over their financial operations.
To see a full list of what's new in 2.10.1404, see our release notes.
Devart Excel Add-in for FreshBooks is licensed per user and is available as a Perpetual license with 1 year support and maintenance. See our Devart Excel Add-in for FreshBooks licensing page for full details.
Devart Excel Add-in for FreshBooks is available in the following products:
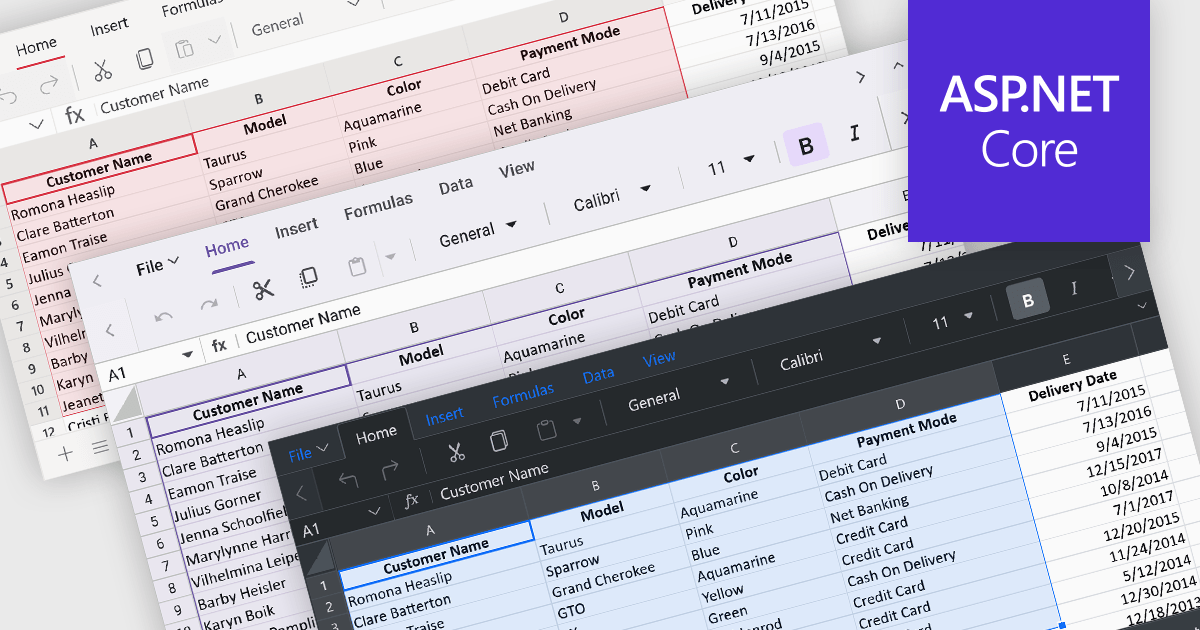
Theming provides users with the ability to customized the visual elements like colors, fonts, and layouts to create a consistent and visually appealing user interface to their spreadsheets. By applying themes, you can enhance the overall aesthetic of your spreadsheet, improve readability, and make it more engaging for users. Themes can also help to align your spreadsheet with your brand guidelines, creating a cohesive and professional look.
Several ASP.NET Core spreadsheet controls offer support for applying themes including:
For an in-depth analysis of features and price, visit our ASP.NET Core spreadsheet controls comparison.
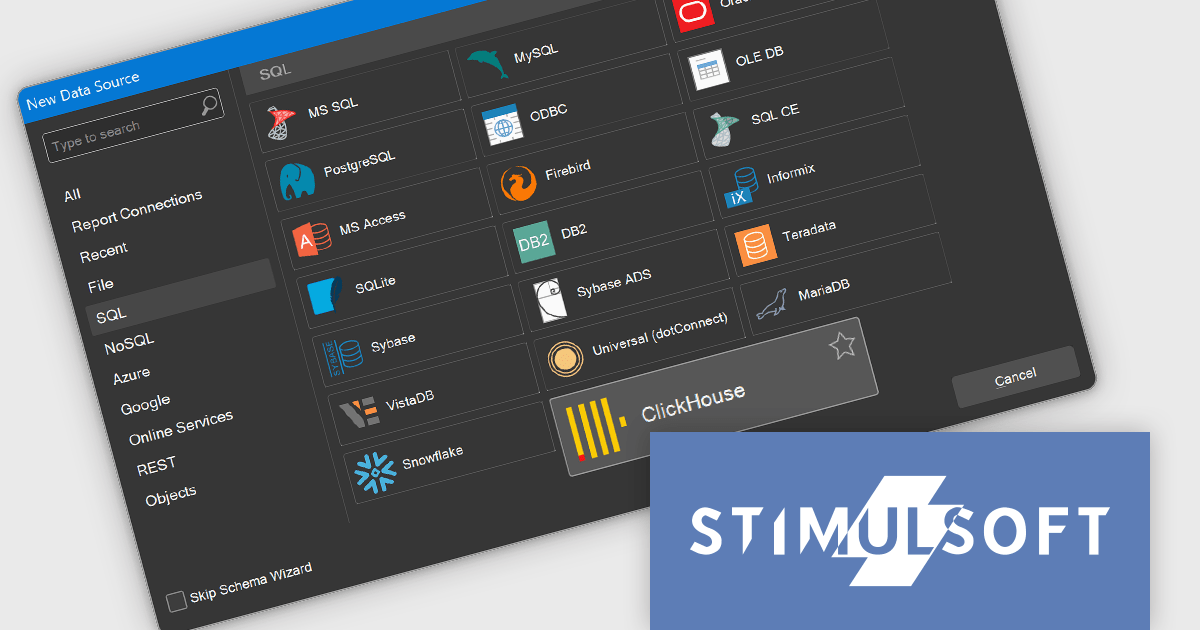
Stimulsoft Reports.WEB is a cross-platform reporting solution designed for integration within web applications. It leverages a client-server architecture for report generation, viewing, printing, and exporting directly in web browsers. Its powerful .NET report engine offers efficient report processing, a user-friendly HTML5 report designer for building reports with various data sources and visualizations, and an interactive HTML5 viewer for seamless report display within web applications. This integration allows developers to implement robust reporting functionalities without browser plugins or additional client-side dependencies.
The Stimulsoft Reports.WEB 2024.4.1 release adds the ability to connect to the ClickHouse online data storage and exchange service directly from the report designer. This eliminates the need for complex data extraction and transformation processes, streamlining the reporting workflow and improving efficiency. By connecting to ClickHouse, users can leverage its powerful analytical capabilities and real-time data processing features to generate dynamic and informative reports.
To see a full list of what's new in 2024.4.1, see our release notes.
Stimulsoft Reports.WEB is licensed per developer and is available as a perpetual license with 1 year support and maintenance. See our Stimulsoft Reports.WEB licensing page for full details.
Stimulsoft Reports.WEB is available in the following products:
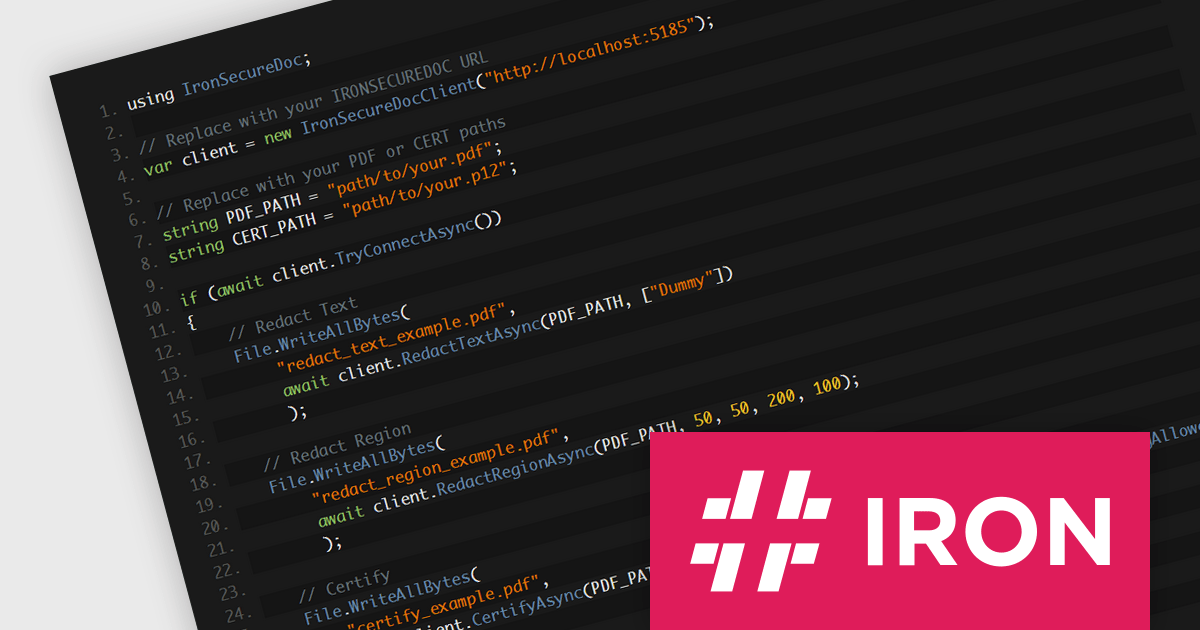
IronSecureDoc by Iron Software is a comprehensive solution for document security, designed to protect sensitive information throughout its lifecycle. This Docker container provides powerful PDF manipulation behind a simple REST API. It offers features for redacting and encrypting data, permissions and certification, whilst enabling you to comply with PDF/A and PDF/UA. By leveraging advanced security technologies, IronSecureDoc helps organizations safeguard confidential data, comply with regulatory standards, and mitigate the risks associated with data breaches.
Its encryption capabilities ensure that confidential information remains protected even if documents are compromised or lost. Access controls allow organizations to restrict access to specific individuals or groups, preventing unauthorized disclosure. Additionally, digital signatures provide tamper-evident verification, ensuring the integrity and authenticity of documents. These features are particularly valuable for organizations dealing with highly confidential data, such as healthcare records, financial information, or intellectual property. IronSecureDoc integrates seamlessly into existing workflows, allowing developers to embed document protection features directly into their applications, streamlining PDF security and compliance tasks without the need for third-party software.
IronSecureDoc is available as a perpetual license with unlimited users, locations, and projects. Support and product updates are included for 1, 2, 3, 4 or 5 years depending on the license option purchased. See our IronSecureDoc licensing page for full details.
IronSecureDoc is available in the following products:
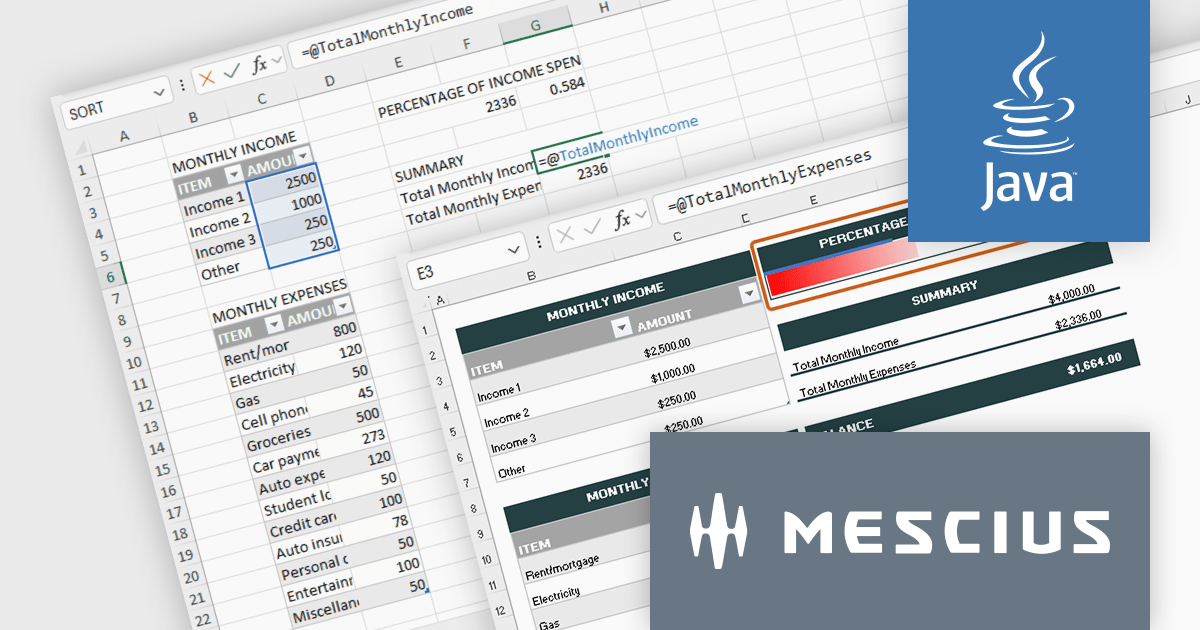
Document Solutions for Excel, Java Edition is a high-speed Java Excel spreadsheet API library that that enables you to programmatically create, edit, import, and export Excel XSLX spreadsheets from Java applications. Develop in Java for Windows, Linux, and Mac and deploy to the Cloud, including Azure, AWS, and AWS Lambda. The interface-based API is modeled on Excel's document object model, which means you can import, calculate, query, generate, and export any spreadsheet scenario, create full reports, sort/filter tables, sort/filter pivot tables, dashboard reports, add charts, sparklines, conditional formats, import and export Excel templates and also convert spreadsheets to PDF, HTML, or an Image type.
In this blog post, MESCIUS Product Marketing Specialist Mackenzie Albitz takes you through the steps for adding an Excel API to your Java application, including:
Detailed instruction and sample code are included.
Read the full blog to learn how to deploy spreadsheets at scale across Java applications.
Document Solutions for Excel, Java Edition is licensed per developer and is available in several license options for differing distribution needs. Team licenses are also available for multiple developers within the same organization. See our Document Solutions for Excel, Java Edition licensing page for full details.
Learn more on our Document Solutions for Excel, Java Edition product page.


Tel: (888) 850 9911
Fax: +1 770 250 6199


