


Official Supplier
As official and authorized distributors, we supply you with legitimate licenses directly from 200+ software publishers.
See all our Brands.
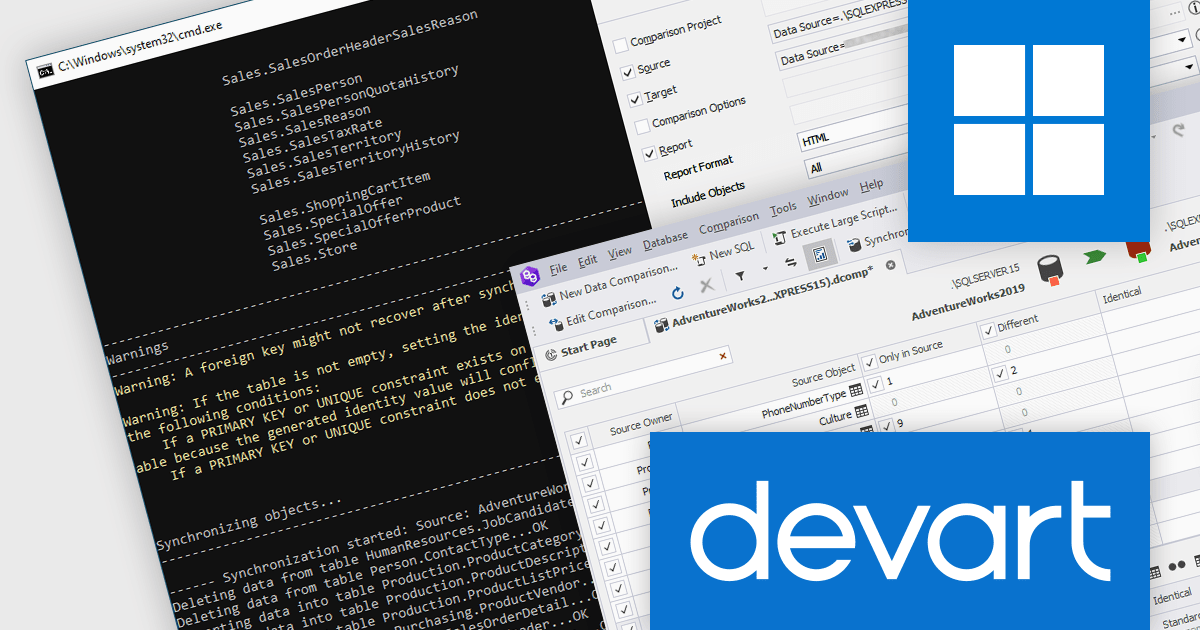
dbForge Data Compare for SQL Server is a powerful data comparison and synchronization tool from Devart designed to streamline the process of identifying and resolving differences between SQL Server databases. It offers a user-friendly interface that allows for efficient comparison of database structures, data, and scripts, making it invaluable for tasks such as schema migration, data validation, and database auditing. The tool provides comprehensive reporting and synchronization capabilities, enabling users to accurately track changes and maintain data integrity across multiple SQL Server environments.
The dbForge Data Compare for SQL Server V7.0.158 release adds the ability to generate comparison reports from the command line, allowing for seamless integration into automated scripting and scheduling, and enabling regular comparison tasks to be executed without manual intervention.
To see a full list of what's new in V7.0.158, see our release notes.
dbForge Data Compare for SQL Server is licensed per developer and is available as an Annual or Perpetual License with a 12 month support and maintenance subscription. See our dbForge Data Compare for SQL Server licensing page for full details.
dbForge Data Compare for SQL Server is available in the following products:
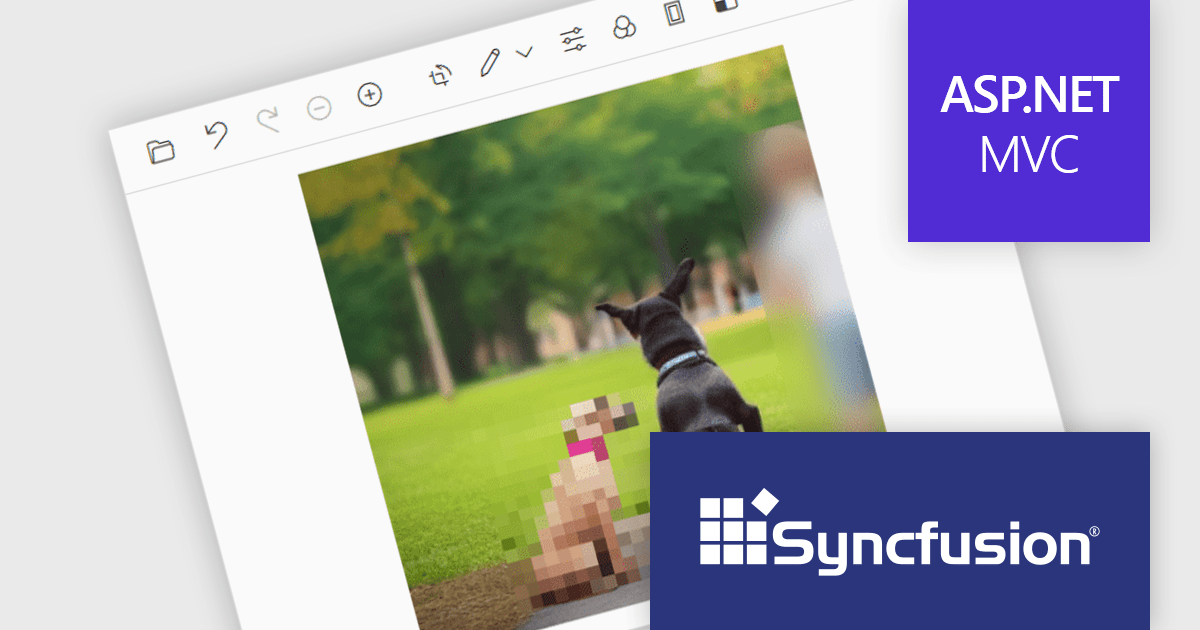
Syncfusion Essential Studio ASP.NET MVC, available as part of Syncfusion Essential Studio Enterprise, is a comprehensive suite of web UI controls that empowers developers to craft rich, interactive ASP.NET MVC applications. Backed by the lightweight and modular Essential JS 2 library, it offers over 80 components ranging from data grids and charts to schedulers and pivot grids, while ensuring a seamless integration with the MVC framework for an efficient development experience.
The Syncfusion Essential Studio ASP.NET MVC 2024 Volume 3 release adds support for redacting images in the Image Editor control, allowing users to conceal sensitive information by applying blur or pixel effects to specific areas of an image. This is particularly useful for protecting privacy and complying with data protection regulations, making it easier to securely share images without compromising sensitive information.
To see a full list of what's new in 2024 Volume 3, see our release notes.
Syncfusion Essential Studio ASP.NET MVC is available as part of Syncfusion Essential Studio Enterprise which is licensed per developer starting with a Team License of up to five developers. It is available as a 12 Month Timed Subscription License which includes support and maintenance. See our Syncfusion Essential Studio Enterprise licensing page for full details.
Learn more on our Syncfusion Essential Studio ASP.NET MVC product page.
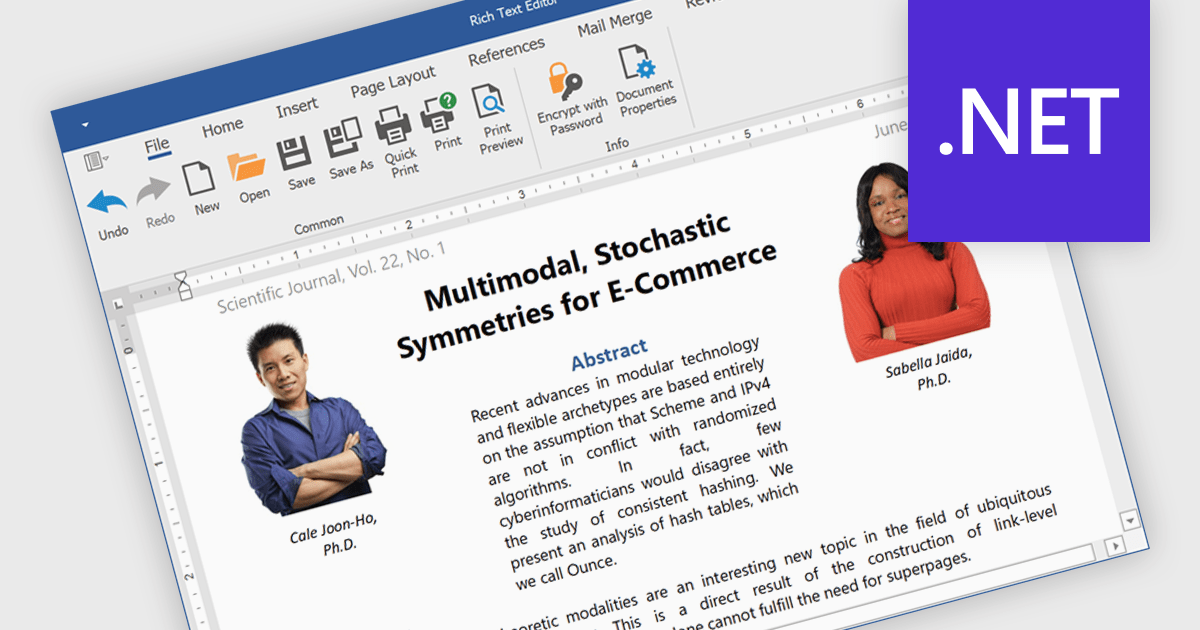
Rich text editors are software tools that enable users to create and format text documents with a wide range of features beyond basic text entry. These editors often include advanced formatting options such as bold, italic, underline, font selection, and color, as well as the ability to insert images, links, and other media elements. Additionally, they may provide tools for creating lists, tables, and other structured content, making them essential for tasks like writing blog posts, creating presentations, or drafting technical documentation.
Several products offer .NET rich text editors including:
Explore our range of .NET rich text editors within Word Processing components.
Need help to find the right software license, upgrade or renewal? Call, Email, or Live Chat with our experts.
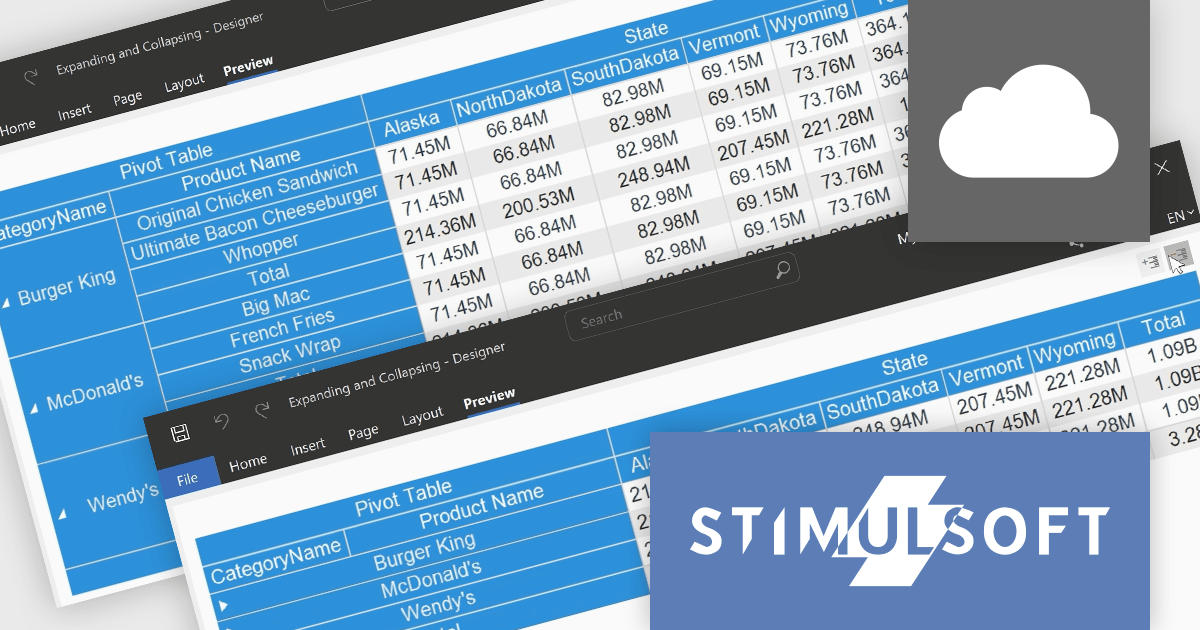
Stimulsoft BI Cloud is a cloud-based business intelligence platform that empowers organizations to create, manage, and share interactive dashboards and reports. By offering a user-friendly interface and a wide range of data visualization tools, Stimulsoft BI Cloud enables users to gain valuable insights from their data, make informed decisions, and improve overall business performance.
The Stimulsoft BI Cloud 2024.4.1 release adds new Expand and Collapse commands, allowing users to show or hide all groups in a pivot table at once. By quickly revealing or concealing granular details, users can easily navigate complex datasets, identify trends, and focus on specific areas of interest without manually adjusting each group individually.
To see a full list of what's new in 2024.4.1, see our release notes.
Stimulsoft BI Cloud is available as an annual license and is licensed per creator. A creator has an account on the server, has access from the client-side, registered as an editor, and uses the product to work with report templates and dashboards - create, edit, view, delete, etc. See our Stimulsoft BI Cloud licensing page for full details.
Stimulsoft BI Cloud is available in the following products:
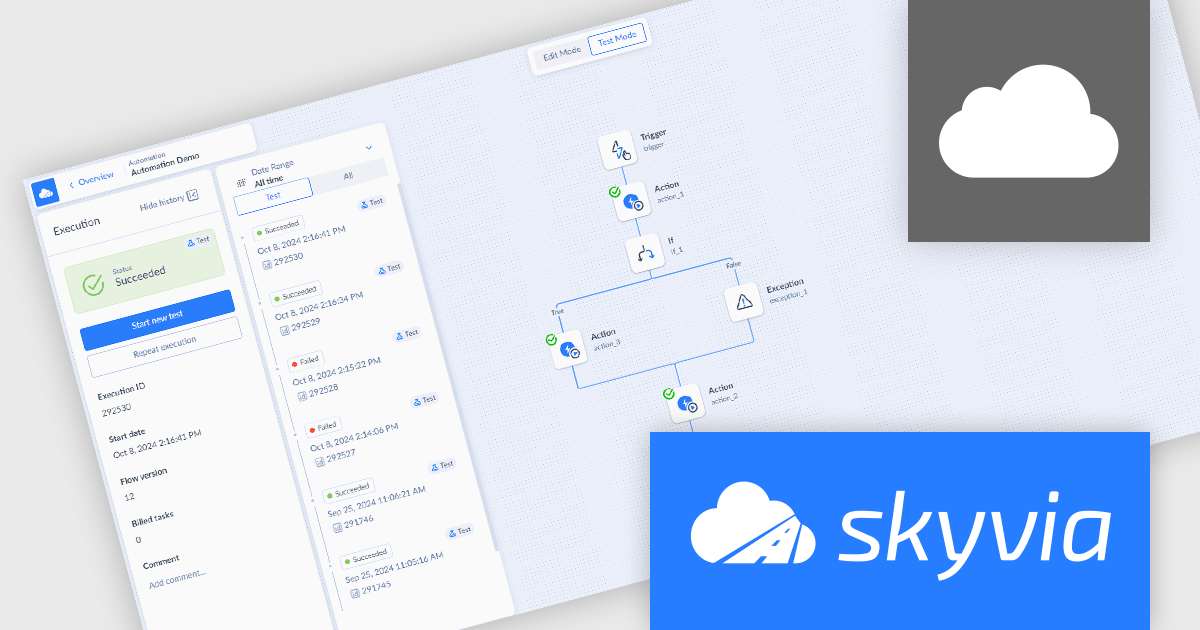
Skyvia Automation is a cloud-based platform that empowers businesses to streamline and automate repetitive tasks across various applications and data sources. By connecting different systems and triggers, users can create complex workflows, reducing manual labor and increasing efficiency. Its intuitive interface and extensive library of connectors make it a popular choice for automating data-driven processes.
The Skyvia Automation October 2024 release adds a new Test mode, enabling you to test and debug your automation while building or editing it. This iterative process allows developers to identify and rectify errors early on, preventing potential issues from disrupting operations. By simulating real-world scenarios and verifying the automation's behavior, developers can refine its logic, optimize performance, and ultimately deliver a robust and efficient solution.
To see a full list of what's new in October 2024, see our release notes.
Skyvia Automation is licensed based on the number of tasks per month and is available as an Annual License. See our Skyvia Automation licensing page for full details.
Learn more on our Skyvia Automation product page.


Tel: (888) 850 9911
Fax: +1 770 250 6199


