


Official Supplier
As official and authorized distributors, we supply you with legitimate licenses directly from 200+ software publishers.
See all our Brands.
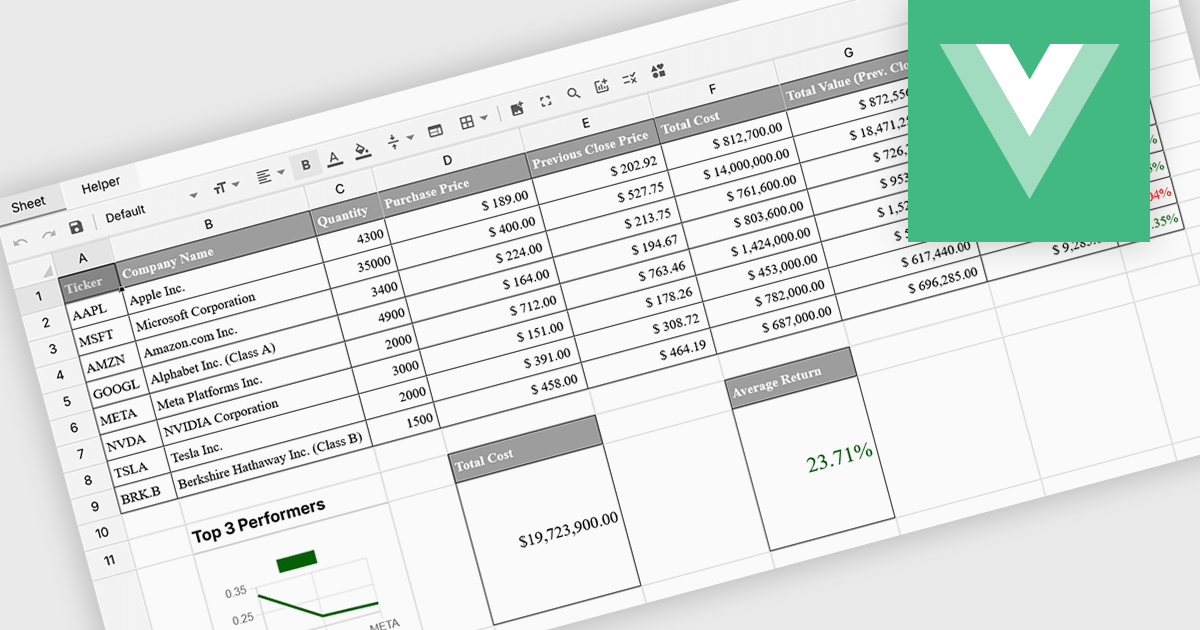
Formula and function support in spreadsheets enables users to perform mathematical, statistical, financial, and logical calculations directly within cells, transforming raw data into meaningful results. By automating calculations and ensuring consistent logic across datasets, this capability improves accuracy, saves time, and supports real-time updates as data changes. It allows users to analyze trends, validate data, and model scenarios without relying on external tools. Common use cases include financial forecasting, budgeting, statistical analysis, performance reporting, and operational planning, making spreadsheets a powerful and flexible platform for data-driven decision-making across business, finance, and technical teams.
Several Vue spreadsheet controls offer formula and function support including:
For an in-depth analysis of features and price, visit our Vue spreadsheet controls comparison.
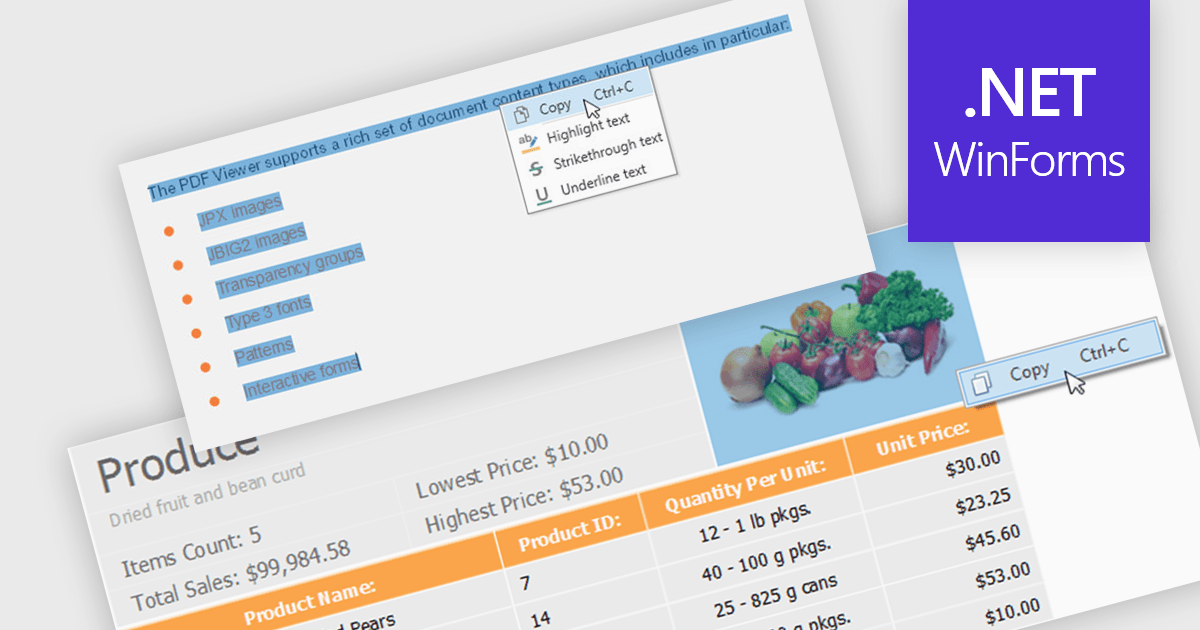
Extracting content using a PDF Viewer refers to enabling end users or applications to select and retrieve content directly through the viewer’s user interface, based on interactive actions such as text selection, area selection, or page-level capture. For software developers, this means the viewer acts not only as a rendering surface but also as a controlled extraction layer that exposes selected text, images, or regions. This approach is valuable in review, approval, and data capture scenarios because it reflects explicit user intent, aligns extracted data with what is visibly selected on screen, and avoids reliance on background parsing alone, resulting in more predictable and user-driven content retrieval within applications.
Several WinForms PDF Viewer components allow content extraction, including:
For an in-depth analysis of features and price, visit our comparison of WinForms PDF Viewer components.
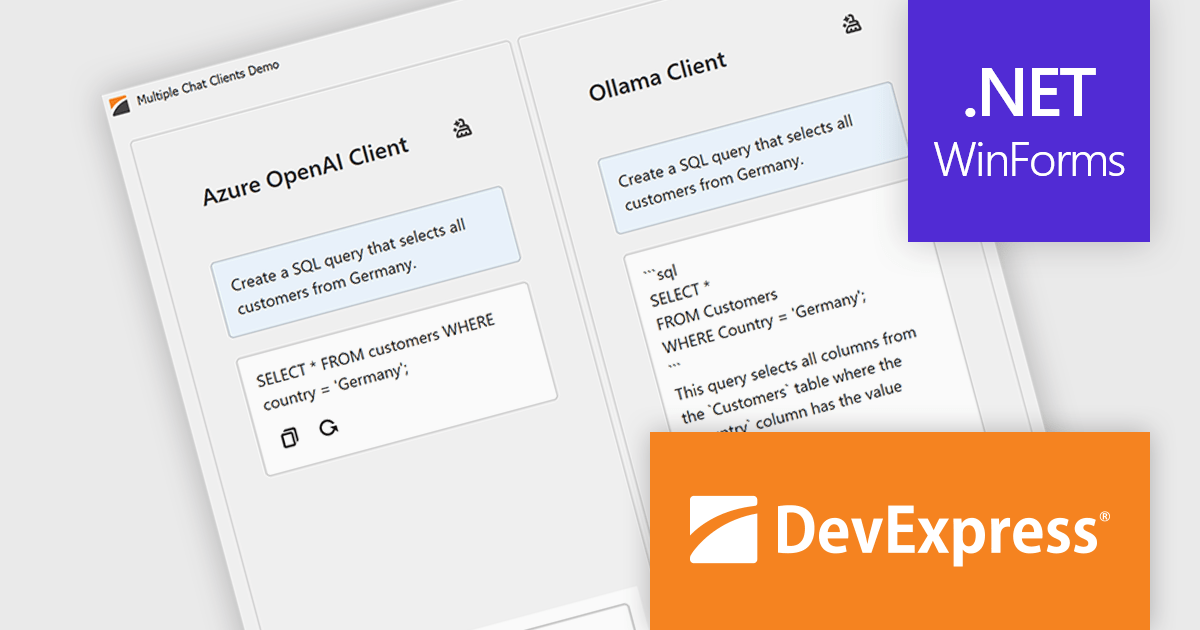
DevExpress WinForms is a comprehensive suite of 190+ UI controls and development tools designed for building high-performance desktop applications. It offers a broad array of customizable controls, from data grids and ribbon interfaces to advanced charts, maps, and diagramming components. This empowers developers to rapidly create functionally rich applications, while adhering to accessibility guidelines and touch-enabled technology for modern Windows environments.
The DevExpress WinForms 25.2 update introduces multi-provider support in the AI Chat Control, allowing developers to integrate several AI services into one application. This enables advanced use cases such as side-by-side comparison of responses from different AI models, concurrent sessions with independent chat histories, and dynamic switching between providers during runtime. It’s especially useful in environments where evaluating model performance or offering user choice is essential, such as customer support tools, research platforms, or development sandboxes.
To see a full list of what's new in version 25.2, see our release notes.
DevExpress WinForms is licensed per developer and is available as a Perpetual License with a 12 month support and maintenance subscription. See our DevExpress WinForms licensing page for full details.
DevExpress WinForms is available individually or in the following products:
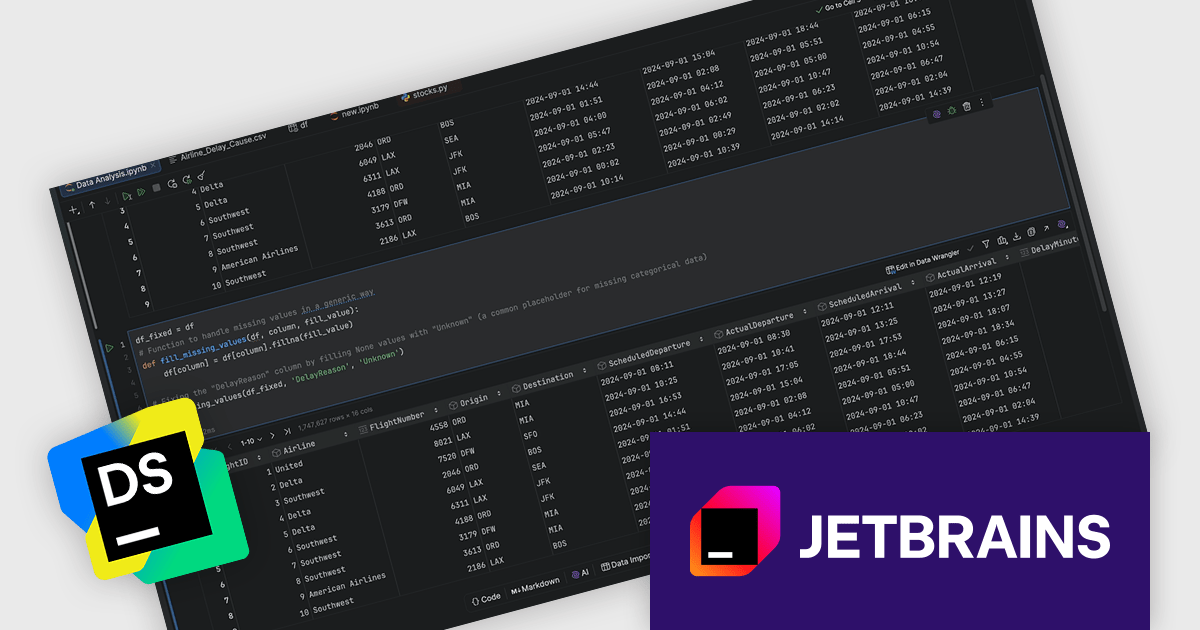
DataSpell by JetBrains is an Integrated Development Environment (IDE) specifically designed for data analysts and engineers. It allows you to write Python scripts, run SQL queries, analyze data in Jupyter notebooks, manage dbt workflows, and connect to databases, all within one interface. DataSpell helps you to stay focused on exploring insights and delivering high-quality results by combining rich data analysis tools with features like real-time error checking, code quality analysis, and built-in support for best practices like testing and documentation.
The DataSpell 2025.3 update improves Jupyter processing by automatically detecting common data quality issues during exploration, including missing values, outliers, duplicates, formatting inconsistencies, and correlated or redundant features. It then provides AI powered suggestions and can generate the required code to address the issue by inserting a new cell in the same notebook, which reduces the time spent on investigation and cleanup.
To see a full list of what's new in version 2025.3, see our release notes.
DataSpell is licensed per user as a commercial annual subscription. See our DataSpell licensing page for full details.
DataSpell is available individually or as part of JetBrains All Products Pack.
ComponentOne Studio WinForms by MESCIUS is a comprehensive toolkit offering over 120 advanced UI components to improve Windows Forms application development. It helps you to build visually appealing and feature-rich applications with functionalities like data visualization through charts and reports, intuitive data editing with performant grids, and modern UI elements including ribbons and docking for a user-friendly experience.
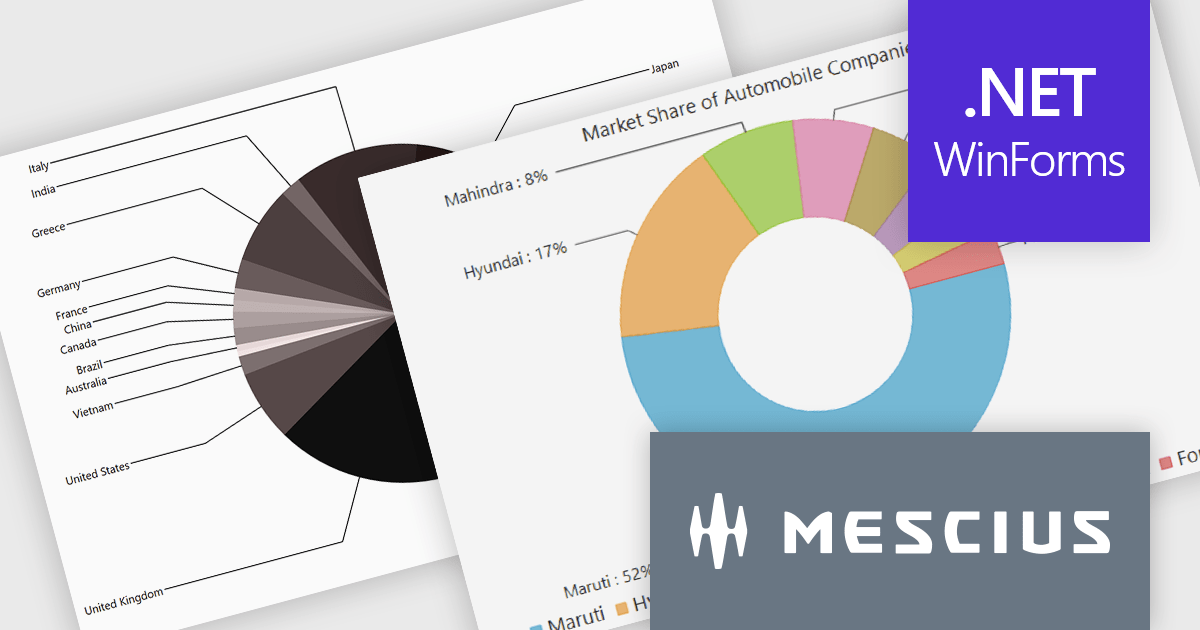
The ComponentOne Studio WinForms 2025 v2 update introduces a new data label placement option for FlexPie that aligns labels along the left and right sides of the chart to improve readability and visual structure. By moving labels out of the pie area, this option reduces overlap and congestion when working with datasets that contain many slices or small values, which are common challenges in pie chart rendering. The result is a more consistent and predictable layout that helps developers present data more clearly while maintaining a clean, modern appearance across different screen sizes and data scenarios.
To see a full list of what's new in 2025 v2, see our release notes.
ComponentOne Studio WinForms is licensed per developer on a perpetual basis and includes a 12 month subscription. Priority Support is also available. See our ComponentOne Studio WinForms licensing page for full details.
Learn more on our ComponentOne Studio WinForms product page.


Tel: (888) 850 9911
Fax: +1 770 250 6199


