


Official Supplier
As official and authorized distributors, we supply you with legitimate licenses directly from 200+ software publishers.
See all our Brands.
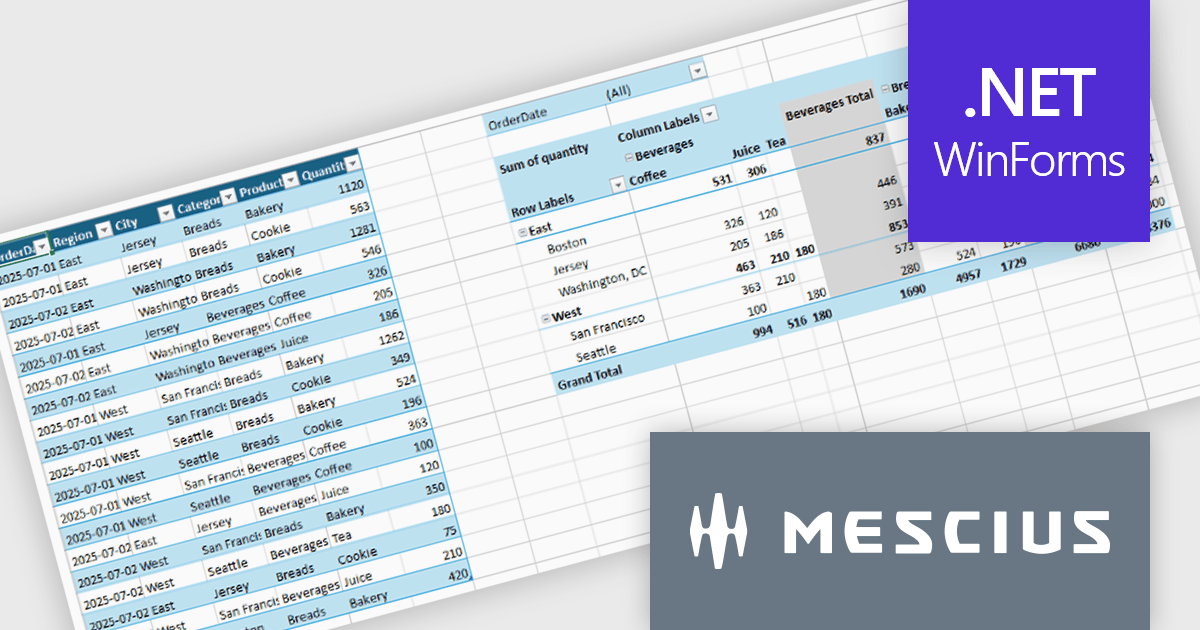
Spread.NET by MESCIUS is a tool for building Excel-like applications in your .NET projects. It lets you create interactive spreadsheets, grids, dashboards, and even forms within WinForms, ASP.NET, and WPF applications. With its rich feature set, including a robust calculation engine, formula support, and Excel compatibility, Spread.NET helps developers to build data analysis tools, budgeting apps, scientific dashboards, and more, all within the familiar .NET environment.
The Spread.NET v19 update introduces a new pivot table engine that enables software developers to summarize, analyze, and explore large datasets directly within WinForms applications. This built-in capability supports interactive grouping, filtering, and multidimensional analysis inside the spreadsheet, allowing users to work with complex data without exporting it to external reporting or business intelligence tools. By delivering Excel-like pivot table functionality with high performance and programmatic control, the pivot engine helps developers simplify application architecture, reduce dependencies, and provide a more integrated and responsive data analysis experience for end users.
To see a full list of what's new in v19, see our release notes.
Spread.NET is licensed per developer and is available as a Perpetual License with a 12 month support and maintenance subscription. We can supply any Spread.NET license including new licenses, maintenance renewals, and upgrade licenses. See our Spread.NET licensing page for full details.
For more information, visit our Spread.NET product page.
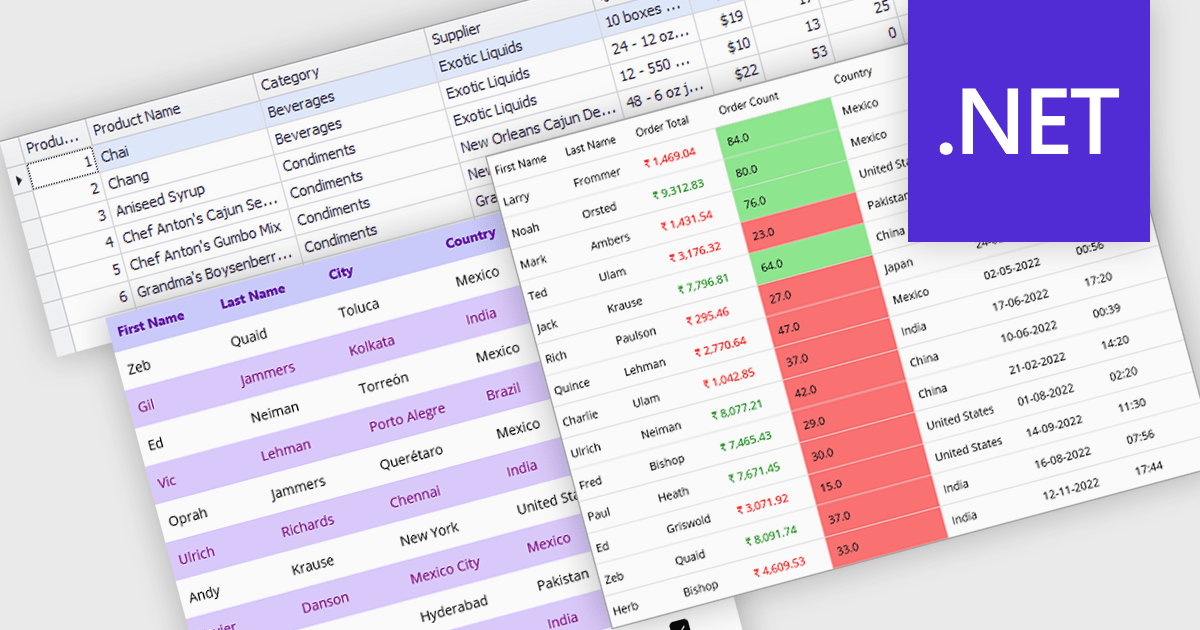
Data grids with column spanning functionality can be configured so the columns collectively extend to fill the entire width of the container, eliminating unused or empty space at the grid's edges. This behavior ensures that available horizontal space is distributed across columns rather than leaving fixed-width gaps, resulting in a more balanced and visually consistent layout. The primary benefits are improved readability, more efficient use of screen space, and a layout that adapts smoothly to resizing and different display sizes without requiring manual adjustment of individual column widths.
Several .NET grid components allow column spanning, including:
For an in-depth analysis of features and price, visit our comparison of .NET grid components.
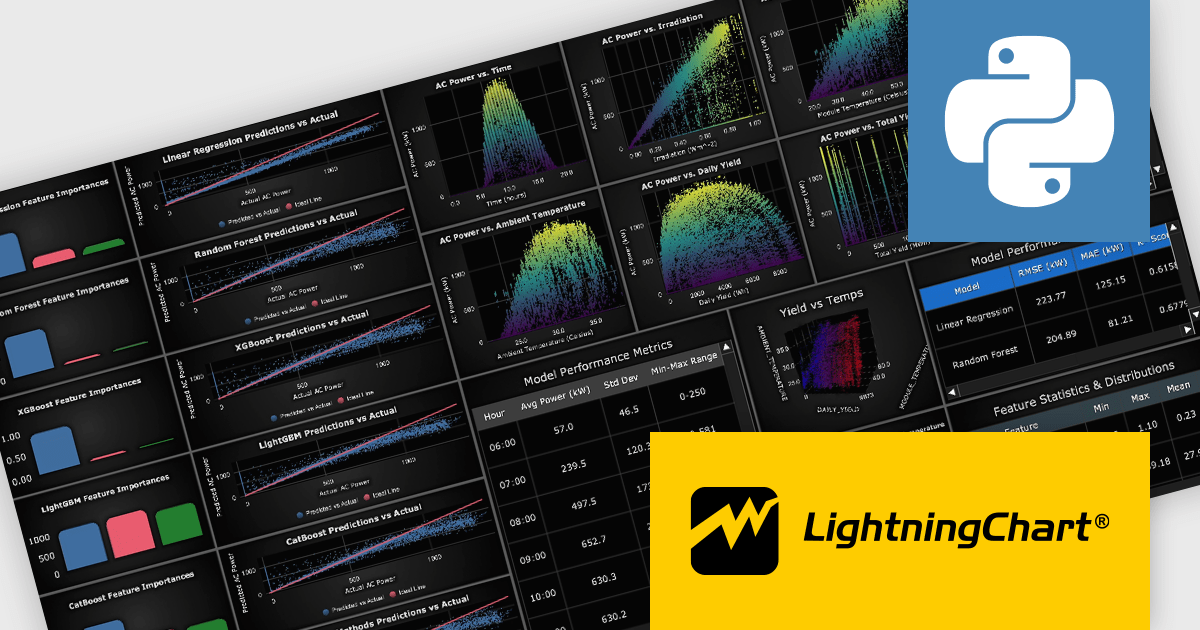
LightningChart Python is a high-performance visualization library designed for real-time analytics and large-scale data rendering. Utilizing GPU acceleration and WebGL, it efficiently processes millions of data points in 2D and 3D with smooth, interactive visuals. Some example chart types include Line graphs, Scatter plots, Heatmaps, Area plots, Box plots, 3D Surface graphs and Mesh plots, and it supports UI elements such as CustomTicks, interval Bands and Constant Lines. It integrates with Python’s data ecosystem, including numpy, pandas, and GUI frameworks like PyQt and PySide, making it a powerful tool for interactive dashboards, financial analytics, scientific simulations, and engineering applications.
The LightningChart Python v2.1 update introduces a new DataGrid component that allows software developers to present metrics, KPIs, and trend information in a single, structured view, combining textual data, numeric values, and compact in-cell charts. By embedding visual context such as sparklines, markers, and thresholds directly within the grid, developers can deliver clearer, more actionable insights without relying on separate chart components. The DataGrid also provides extensive control over styling, enabling consistent integration with existing application designs while reducing the effort required to build and maintain custom data presentation solutions.
To see a full list of what's new in v2.1, see our release notes.
LightningChart Python offers two licensing options: the subscription-based Data Scientist License for internal, non-public facing usage and the perpetual, per-seat Software Developer License for commercial use with professional support and deployment keys. Both licenses allow one active session per user, with developer licenses assigned individually. See our LightningChart Python licensing page for full details.
For more information, see our LightningChart Python product page.
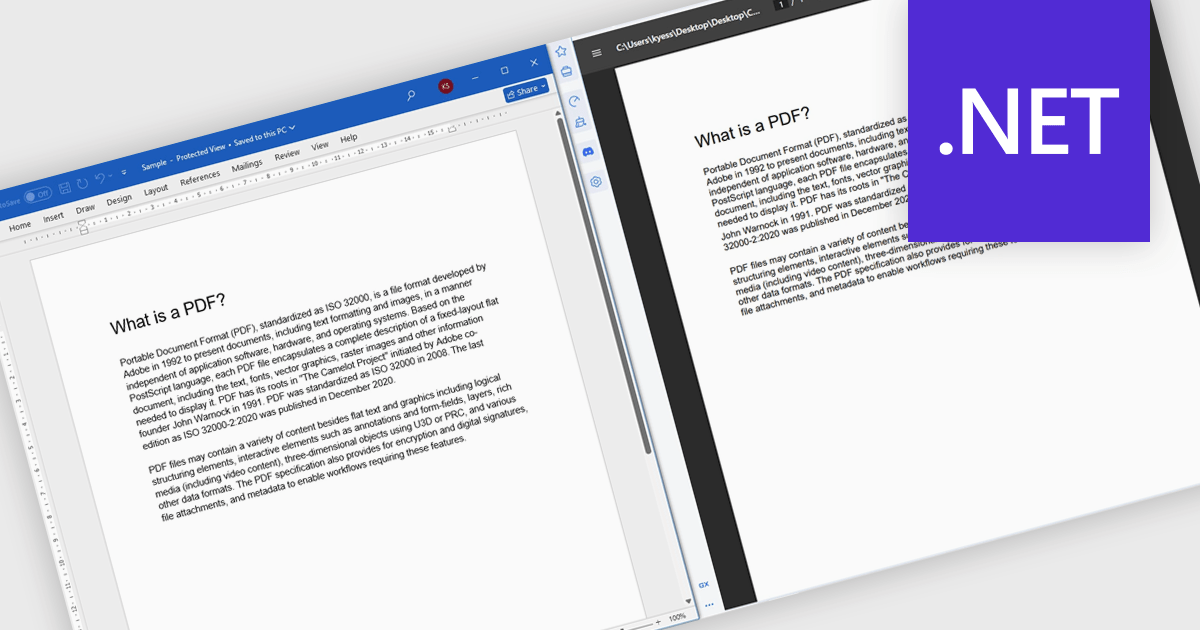
Converting Word to PDF involves transforming DOC or DOCX documents into a fixed, universally supported format that preserves formatting, layout, fonts, and images. This process ensures documents display consistently across different devices, operating systems, and applications, regardless of whether the recipient has Microsoft Word installed. By reducing the risk of unintended edits and layout changes, PDF output provides a more secure and professional way to share finalized content. Typical use cases include distributing reports, proposals, and contracts, preparing documents for printing, sharing files with external stakeholders, and archiving important records for long-term storage or compliance purposes.
Several .NET components offer Word to PDF conversion including:
For an in-depth analysis of features and price, visit our comparison of .NET PDF components.
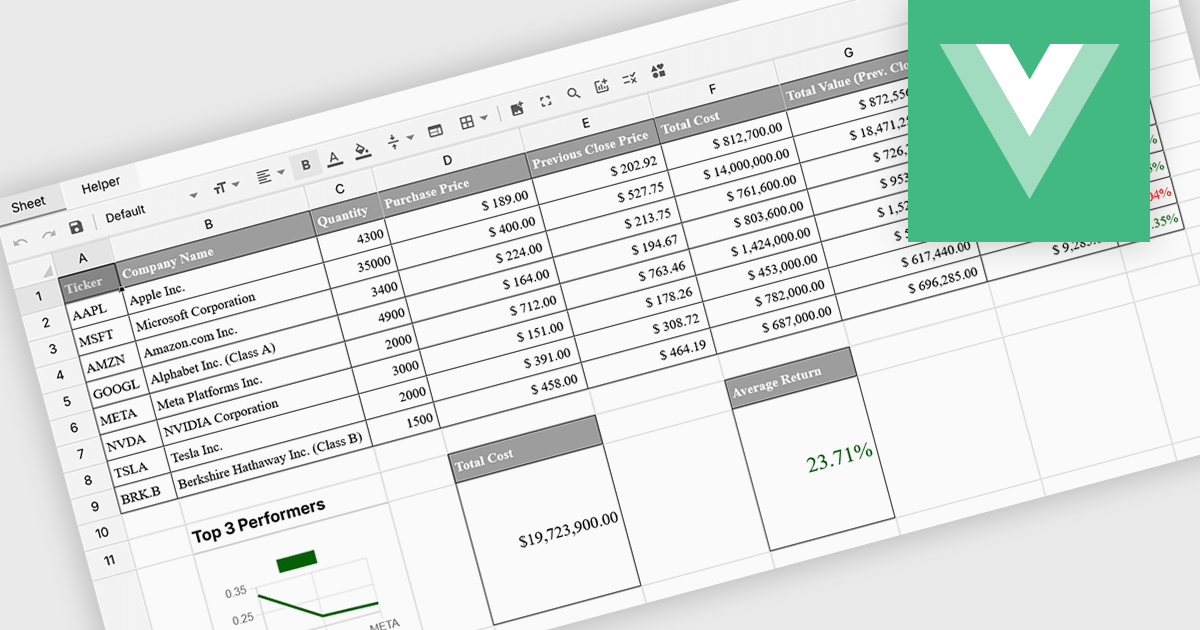
Formula and function support in spreadsheets enables users to perform mathematical, statistical, financial, and logical calculations directly within cells, transforming raw data into meaningful results. By automating calculations and ensuring consistent logic across datasets, this capability improves accuracy, saves time, and supports real-time updates as data changes. It allows users to analyze trends, validate data, and model scenarios without relying on external tools. Common use cases include financial forecasting, budgeting, statistical analysis, performance reporting, and operational planning, making spreadsheets a powerful and flexible platform for data-driven decision-making across business, finance, and technical teams.
Several Vue spreadsheet controls offer formula and function support including:
For an in-depth analysis of features and price, visit our Vue spreadsheet controls comparison.


Tel: (888) 850 9911
Fax: +1 770 250 6199


