Actipro Silverlight Studio
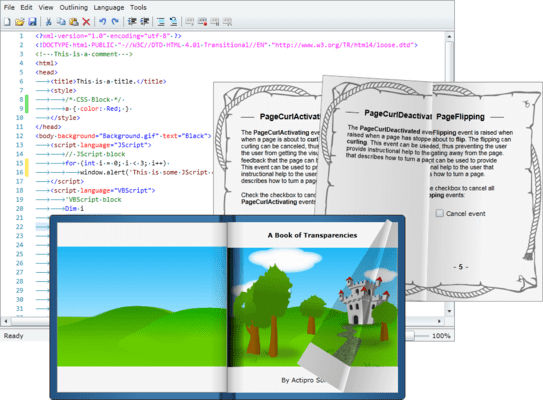
A bundled suite of professional user interface controls (syntax editor, advanced panel, menu etc.) for the Silverlight framework.
Published by Actipro Software
Distributed by ComponentSource since 2002
We do not supply this product anymore.
A bundled suite of professional user interface controls (syntax editor, advanced panel, menu etc.) for the Silverlight framework.
Published by Actipro Software
Distributed by ComponentSource since 2002

Micro Charts is a set of charts, also sometimes called sparklines, that visualize quantitative data and are designed to render clearly in compact spaces. Many chart types are supported, from basic line and bar charts to stacked area charts. The chart control includes numerous useful features such as multiple series, stacking, hot tracking, customizable palettes, and data aggregation. Additional types of small charts like heat maps are included as well. Common usage scenarios for micro charts are within dashboards, reports, and grids.


Image 1 / 2


As official and authorized distributors, we supply you with legitimate licenses directly from 200+ software publishers.
See all our Brands.
Over 1,400,000 licenses delivered to Developers, SysAdmins, Corporations, Governments & Resellers, worldwide.
Read more about us.
Tel: (888) 850 9911
Fax: +1 770 250 6199
