TeeChart .NET for Avalonia
Interactive charts, maps and gauges for desktop, web and mobile.
Published by Steema Software
Distributed by ComponentSource since 1998
Prices from: $ 371.42 Version: 2023 Updated: Oct 27, 2023
Interactive charts, maps and gauges for desktop, web and mobile.
Published by Steema Software
Distributed by ComponentSource since 1998
Prices from: $ 371.42 Version: 2023 Updated: Oct 27, 2023

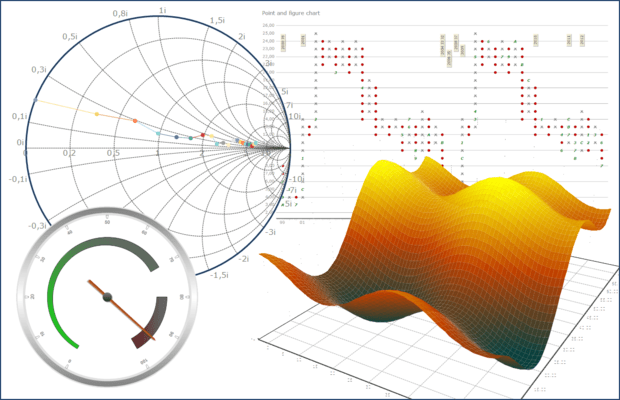
The Chart component is packed with functionality to produce high-class financial charting applications. Functions and indicators include: Open-High-Low-Close Series, Candle, Volume and Moving Average Convergence/Divergence (MACD), ADX, Stochastic, Bollinger Bands, Momentum, Moving Average and many more statistical functions. Enhanced Chart types include Surface, ColorGrid, Smith and several Gauge types.


As official and authorized distributors, we supply you with legitimate licenses directly from 200+ software publishers.
See all our Brands.
Over 1,400,000 licenses delivered to Developers, SysAdmins, Corporations, Governments & Resellers, worldwide.
Read more about us.
Tel: (888) 850 9911
Fax: +1 770 250 6199
