Official Supplier
As official and authorized distributors, we supply you with legitimate licenses directly from 200+ software publishers.
See all our Brands.
Release Notes: new features and improve their report applications. Report Creation and Data Binding Wizard- A new wizard guides users through the steps of creating a basic report, simplifying the report design process ... report templates, streamlining the report design process and ensuring consistency across multiple reports. Nested JSON/XML Data Support- ActiveReports.NET 18 can now handle nested JSON and XML data ... , allowing more complex JSON data structures to be used as data sources. This feature makes working with modern web APIs and complex data models easier. Improved SVG Rendering Quality and Performance ...

Screenshots: .NET data sources allow you to connect to any of the standard databases, plus.NET in-memory objects and collections. 5 ...
Release Notes: to add a possibility to change the order of Export options in JSViewer. Preview shows "The JSON data source has not been found" if the report has the dataset bound parameter and the connection ... from dataset. The parameter does not filter chart data when changing it after loading for the first time. Updated Document Solutions dependencies in hotfix because of breaking changes in Document ... characters for Barcode with symbology UCCEAN128 (GS1-128). Data requests twice for semantic report. Error "Value does not fall within the expected range" on exporting to PDF. 0 ...
Customer Review: 5 Italy ...
Release Notes: create pre-configured controls that they can then add to the ActiveReports toolbox for their end users to drag and drop onto the design surface. Shared Data Source Support added to the Web Designer- ... The WebDesigner and Blazor WebDesigner components now support shared data sources, which are reusable data source connections that may be used in multiple reports. Improved Accessibility of PDF and HTML Document ... display/hide various sections depending on some value in your data. “Insert” and “Duplicate” Items Added to Section Tab Context Menu- With the new Insert and Duplicate context menu items for report sections, ...

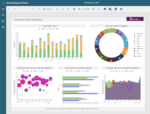
Screenshots: Visualize your data using new graphical components, including Maps, Bullets and Sparklines. 2 ...

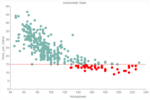
Screenshots: Utilize the Parameters control to filter data based on relevance. Here you can see that after selecting Chicago, only Chicago's Plant performance has been generated. 3 ...
Release Notes: Dynamically apply parameters to a report allowing users to filter the data at runtime. Apply Parameters- Runtime Filtering- You can now dynamically apply parameters to a report allowing users ... to filter the data at runtime. RDL Dashboard Support in WinForms Designer- Added support for RDL Dashboard reports in WinForms. Customization for Blazor Web Designer- Added customization API to the new Blazor ... Designer. Set Chart Colors Based On Values- The background colors of chart data points can now be set using conditional formatting. Freeze Table/Tablix Columns and Rows in the JsViewer- The JsViewer now ...
Customer Review: 5 Italy ...
Release Notes: Adds.NET 7 support along with new Dashboard report type. RDL Dashboard- New Report Type RDL Dashboards offer a convenient way to display data visualization controls such as charts, tables, ... controls and data regions makes dashboards interactive and helps slice and dice the report metrics. Added Microsoft.NET 7.0 support. Added Blazor Web Designer. Web Designer UI Customization Configure ... in the Properties Panel. Two New Chart Templates Range Chart- Display a pair of values (low and high) for each data point to visualize a range of values rather than a single value. Gauge Chart- A bar chart ...

Description: end-user report designers to your users for on-demand reporting. Rich Report Controls- Visualize your data with a wealth of feature-packed controls such as charts, tables, tablix, barcodes, sparklines, maps, ... Services, Data Objects, and runtime data sources even if you can't write a database query. Mix multiple sources in a single project and share reports for optimal efficiency. Top.NET Reporting Features ... and event-driven section reports to create a full-featured report library. Extensible APIs- Control runtime report rendering using the extensible API. Customize report viewers, designers, and report data regions ...

Release Notes: and Table data regions, you can display row numbers for grouped data by using the GroupIndex function. The GroupIndex function returns the row or column number for the specified group. RDL Multi-Section ...

Release Notes: and to easily adjusting margins. Other Features Microsoft Excel Data Export can now export frozen rows and columns within the Table and Tablix controls. Improved the Rules feature to allow you to compare two ... plots. Added specific measures to improve the engine's performance when retrieving data and when exporting to Excel. 0 ...

Release Notes: Adds full support for RPX Section Reports to the ActiveReports Web Designer. RPX Section Reports in the Web Designer- Users can now create, edit and view RPX Section Reports fully in the Web Designer. This includes pre-existing reports created in the Desktop Designer or Visual Studio Integrated ...

Release Notes: a user adds a chart control to the design surface. The wizard helps the user choose from the various chart templates, choose a data set, select the appropriate fields and set chart properties. Page/RDL ... property for the Chart's X-axis. Another benefit of this property is that you can use expressions to create highly customized labels. Custom Data Field Name- You can now set custom text for data field ... rendering. CSV data provider now has a Decimal data type. Keep Table and Tablix groups on one page in Page Reports. ActiveReports.NET animations 0 ...
Customer Review: 5 South Africa ...
Release Notes: able to customize ActiveReports' End-User Report Designers, in this release, the process of controlling the ability to add data sources, datasets, and parameters in the Desktop End-User Report ... Designer has been simplified. Added an "EnabledNodes" property to the Report Explorer component to control the ability of an end-user to add new data sources, datasets, or parameters. By default, ...

Release Notes: to the Image control. Conditional Formatting in Charts- You can now use expressions in charts to conditionally change the text or appearance of Chart labels, tooltips, and data points. Radar Chart Template- ... Radar charts, also known as Spider charts, are a great way to display multivariate data in a two-dimensional visualization. Extended Page Break Properties- With Page and RDL reports, you have more page ... break options when grouping in a data region such as a Table. Dynamic Table Column Widths- Imagine that you have a Table in your report and you want to hide one or more columns based on a condition. While ...

Release Notes: the data fields of interest and drag-and-drop them to the design surface to create a table. Added the ability to re-arrange Table columns at design time. Dropping a data field in the Table's ... "Group" panel now automatically groups data on that field. You can now also add a data field at a specific index in the table. Added new Tablix Wizard: The wizard features drag-and-drop functionality ... allowing you to drop fields from your data set (left panel) to either the Column Group, Row Group, or Values sections. Placing a field under Values will automatically apply the appropriate aggregate, which ...
Customer Review: 4 Belgium ...