Presentation Layer Components News

RSS Feed

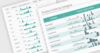
Drive Strategic Decisions with Project Overview

July 4, 2025Product Update
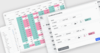
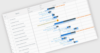
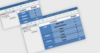
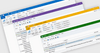
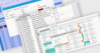
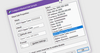
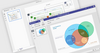
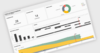
Highcharts Dashboards provides a project status overview, offering progress snapshots, helping teams identify risks and maintain alignment.

Analyze Data Faster with Pivot Grids

July 4, 2025Feature Highlight
Quickly group, filter, and summarize large datasets to reveal trends, simplify reporting, and support more informed decisions.

Freeze Grid Rows and Columns While Scrolling

July 4, 2025Product Update
ComponentOne Studio Blazor Edition 2025 v1 adds the ability to freeze columns to the right and rows to the bottom for improved data visibility.

Build Accessible PDFs with Less Effort

July 4, 2025Feature Highlight
PDF accessibility features simplify compliance, saving developers time while ensuring documents meet key standards.

Add AI-Powered Search to Grid Interfaces

July 4, 2025Product Update
DevExpress WPF v25.1 adds semantic searching, which brings smarter querying to the data grid using NLP to return context-aware results.

Let Users Open and Manage PDFs In-App

July 3, 2025Feature Highlight
Allow users to view, annotate, and manage PDF documents directly within your application, eliminating the need for third-party software.

Add Copyright Element to Maps in WinForms

July 3, 2025Product Update
Telerik UI for WinForms enables you to add copyright labels directly to the map surface, facilitating compliance and trust in mapping applications.

Add Instant Insight with Embedded Mini Charts

July 2, 2025Feature Highlight
Sparklines offer a compact, visual way to show trends directly within reports, helping you to quickly spot patterns without using full-size charts.

Fine-Tune Color Aesthetics with Precision Input

July 1, 2025Product Update
Syncfusion Essential Studio .NET MAUI 2025 Volume 2 (30.1.37) adds a Color Picker with spectrum modes, custom colors, and theme support.

Use Gantt Charts to Coordinate Time-Critical Tasks

July 1, 2025Feature Highlight
Gantt charts map tasks over time, helping teams manage schedules, spot conflicts, and maintain visibility across complex project timelines.

Render Grid Rows Dynamically on Scroll

June 30, 2025Feature Highlight
Use virtual and infinite scrolling to render visible content dynamically, improving the performance of your data grid in JavaScript applications.

Customize Instantly with Built-In Color Tools

June 27, 2025Feature Highlight
Color pickers let users quickly apply color to cells or charts, making trends, outliers, and priorities easier to see at a glance.

Enable OCR in PDF Processing Apps for .NET

June 27, 2025Product Update
The Telerik Document Processing Libraries 2025 Q2 update enhances the PDF processing library with support for optical character recognition (OCR).

Add Dynamic Grouping to Your Reports

June 27, 2025Product Update
ActiveReports v19.1 adds powerful grouping capabilities, enabling report authors to build customizable, interactive layouts with zero code changes.

Align UI Elements With Windows 11 Themes

June 26, 2025Product Update
Codejock Suite Pro 24.2.0 improves theme support, allowing your toolbars and ribbons to reflect Windows 11’s system and custom accent colors.

Organize Data for Faster Insight

June 26, 2025Feature Highlight
Sorting functionality allows spreadsheet users to bring structure to large data sets by arranging rows based on selected column values.

Improve ASCII Input Accuracy

June 26, 2025Product Update
Codejock Toolkit Pro 24.2.0 enhances MaskEdit with case conversion and new modes for precise validation of alphanumeric and hexadecimal input.

Display Complex Data with Hierarchical Navigation

June 25, 2025Product Update
Telerik UI for .NET MAUI 2025 Q2 adds a new TreeDataGrid component that combines the hierarchy of a TreeView with the flexibility of a DataGrid.

View Diagram Files Natively Across Platforms

June 25, 2025Publisher Update
ONLYOFFICE Docs v9.0 adds an integrated diagram viewer with multi-platform support, enabling users to open and navigate Microsoft Visio files.

Animate Charts in Vue.js Applications

June 24, 2025Feature Highlight
Using animation allows developers to create more engaging charts that facilitate an easier understanding and interpretation of the data.