








Official Supplier
As official and authorized distributors, we supply you with legitimate licenses directly from 200+ software publishers.
See all our Brands.
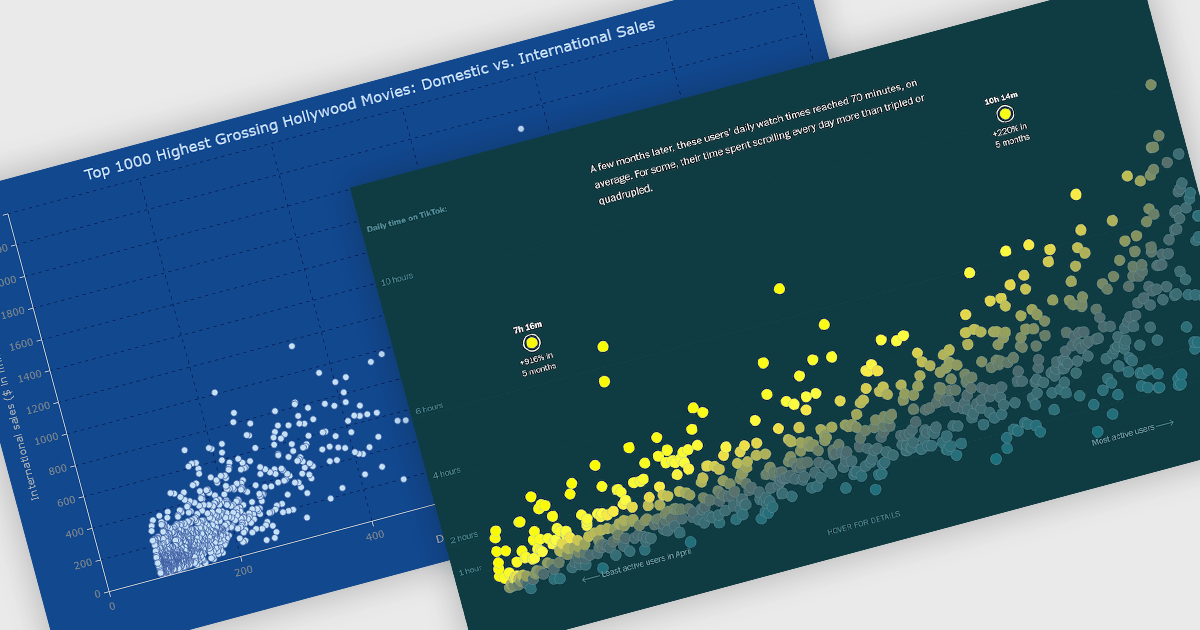
A scatter chart is a visual tool that displays relationships between two variables by plotting data points on an X and Y axis. Each point represents a value pair, helping users quickly identify patterns, correlations, and outliers within complex datasets. Scatter charts effectively highlight trends, clusters, and anomalies that might not be visible in tables. With customizable markers, colors, and sizes, they clearly differentiate data groups. Common use cases include analyzing sales versus marketing spend, comparing temperature and energy use, or assessing customer satisfaction relative to pricing. This turns raw data into clear and actionable visual insights.
Several JavaScript chart controls offer scatter charts including:
For an in-depth analysis of features and price, visit our JavaScript chart controls comparison.
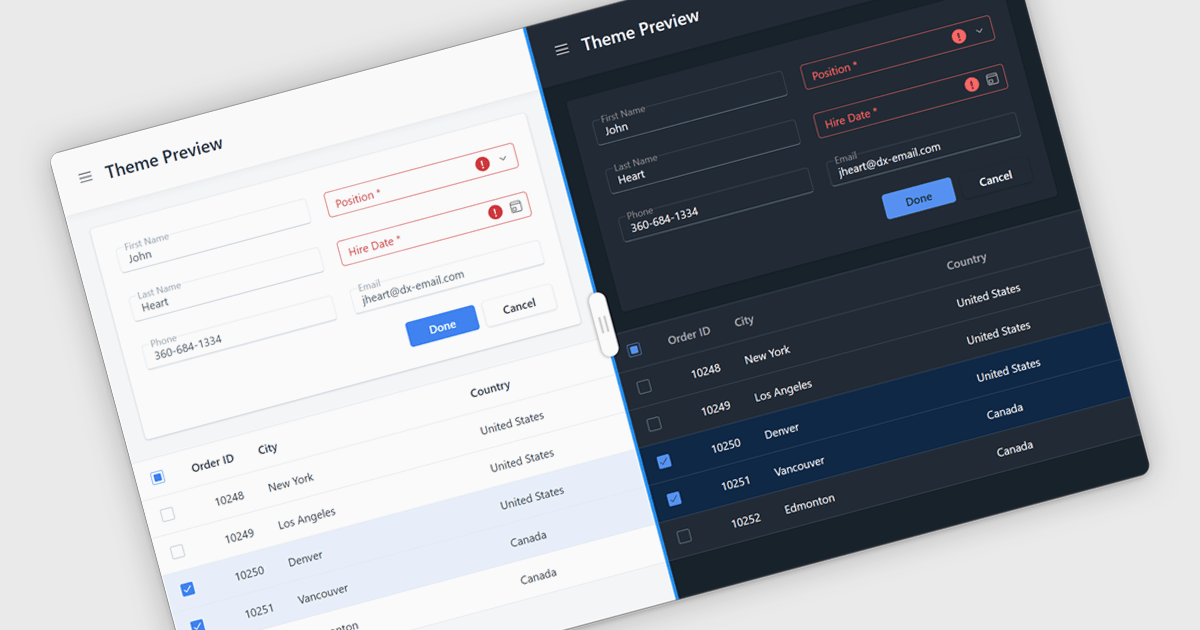
UI suite theming allows developers and designers to define a unified visual style across all components. By controlling colors, typography, spacing, and other design elements from a central configuration, teams can ensure consistency, maintain brand identity, and improve updates. Theming also enables effortless customization, allowing teams to align a product’s look with branding, support light and dark modes, or adapt interfaces for different clients. This approach accelerates development and enhances user experience, making applications feel polished, cohesive, and professional. Common use cases include enterprise dashboards, multi-brand SaaS platforms, and cross-platform applications that require a consistent appearance on web, desktop, and mobile.
Several JavaScript UI suites offer theming support, including:
For an in-depth analysis of features and price, visit our comparison of JavaScript UI suites.
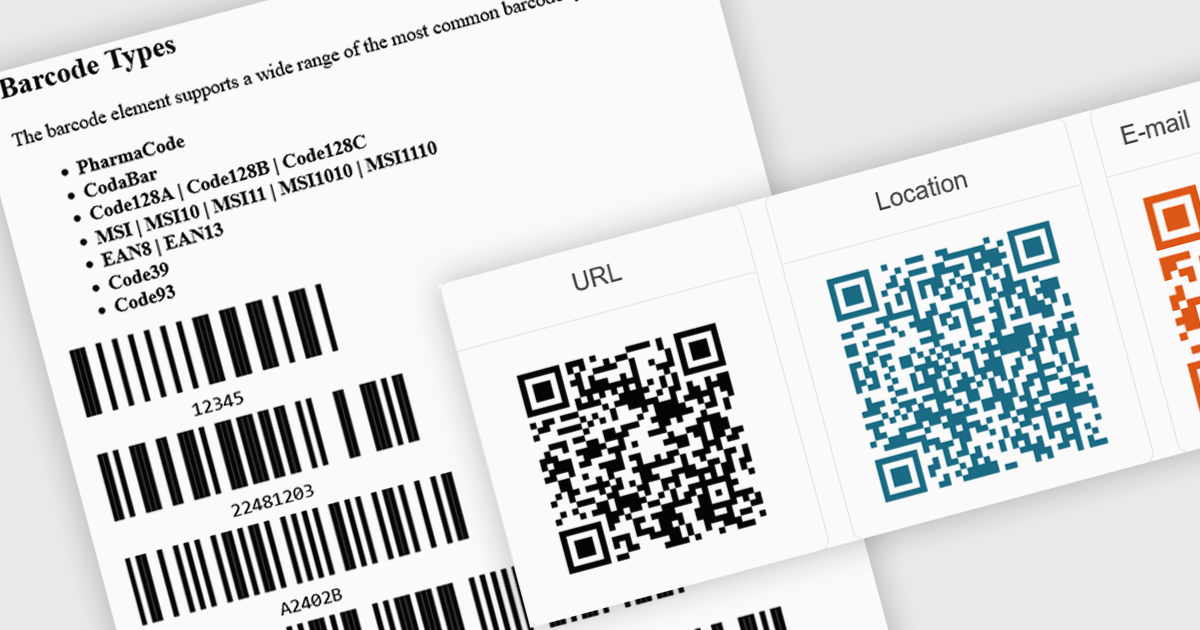
Barcode support in an Angular UI suite refers to built-in components that allow developers to generate and display barcodes directly within their applications. This capability simplifies the integration of barcode-based workflows, such as inventory tracking, product labeling, or user identification, without relying on third-party libraries. By handling various barcode standards and formats natively, these components ensure consistency in rendering and decoding, reduce development time, and enhance application performance and reliability when working with barcode data.
Several Angular UI suites provide barcode controls, including:
For an in-depth analysis of features and price, visit our comparison of Angular UI Suites.
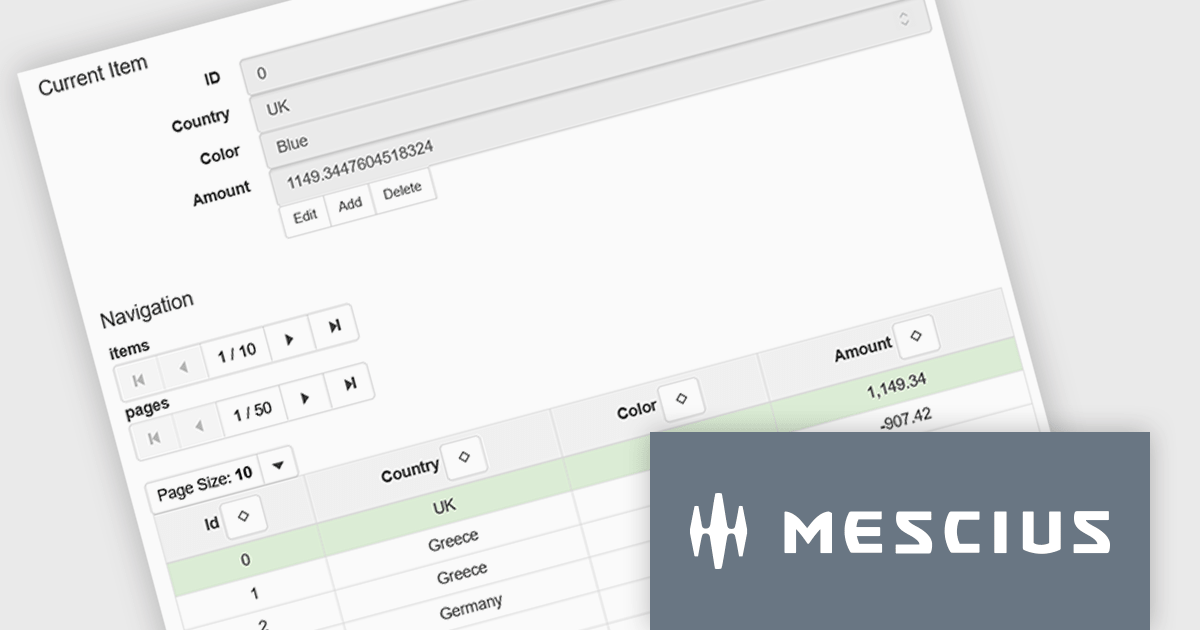
Wijmo is a cutting-edge collection of over 100 high-performance JavaScript UI controls designed for modern enterprise applications. Built for speed and flexibility, Wijmo empowers developers to deliver superior user experiences with fully responsive, touch-friendly, and accessible components. Use Wijmo with any popular JavaScript framework - including Angular, React, Vue, Svelte, or pure JavaScript/TypeScript - for rapid application development across modern web and mobile platforms.
On Wednesday, Nov 5th, at 11:00 AM EST, MESCIUS (formerly GrapeCity) will be presenting a CodeClinic Live Webinar to demonstrate how you can utilize the power and flexibility of the Wijmo CollectionView Class to efficiently handle data in JavaScript applications.
Key highlights include:
Register for the Live Webinar today and mark your calendar for November 5th.
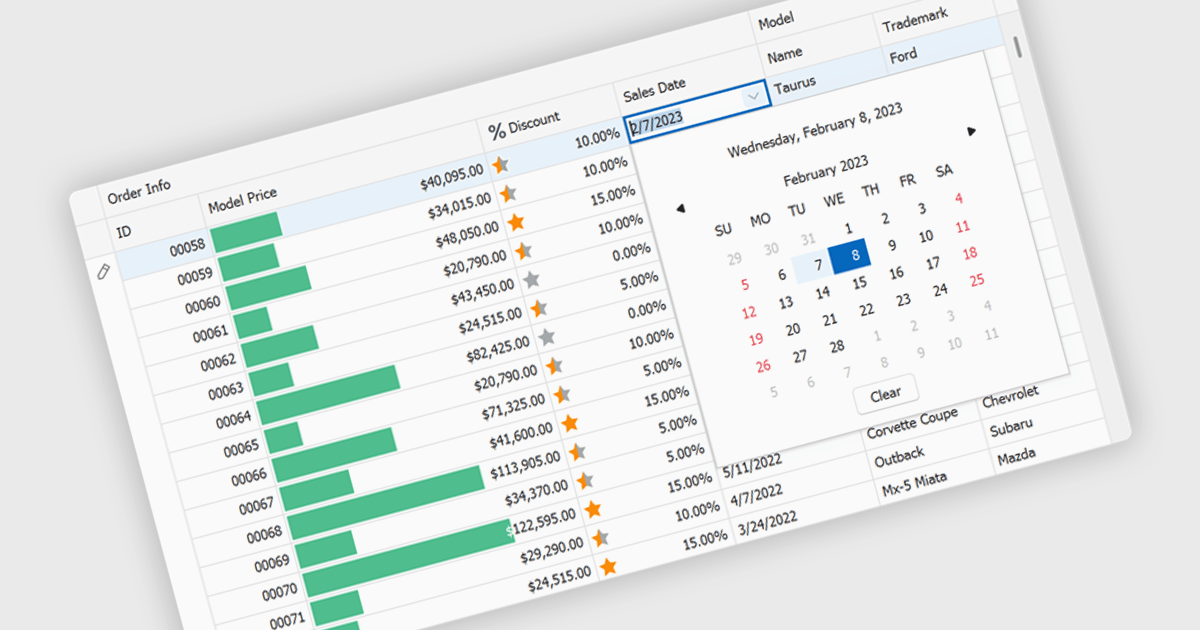
A date editor enables users to easily input, modify, and validate date values through an intuitive interface such as a calendar picker or spinner. This feature ensures consistent date formats across datasets, reduces manual entry errors, and improves overall data integrity. By enforcing validation rules and supporting localization, date editors accommodate a wide range of user needs and regional formats. Common use cases include managing records in applications such as employee databases, scheduling systems, financial reporting tools, and project management dashboards where accurate and consistent date information is essential for reliable data analysis and decision-making.
Several Vue.js data editor collections provide date editors including:
For an in-depth analysis of features and price, visit our Vue.js Data Editors comparison.





Tel: (888) 850 9911
Fax: +1 770 250 6199


