Official Supplier
As official and authorized distributors, we supply you with legitimate licenses directly from 200+ software publishers.
See all our Brands.

Infragistics Professional is a comprehensive toolkit for software developers, offering a wide range of pre-built, high-performance UI components for building visually appealing and feature-rich applications across Angular, React, Web Components, Blazor, ASP.NET MVC, ASP.NET Core, Windows Forms, WPF and Xamarin. It includes controls such as data grids, charts, navigation menus, and more, along with productivity tools to streamline development processes.
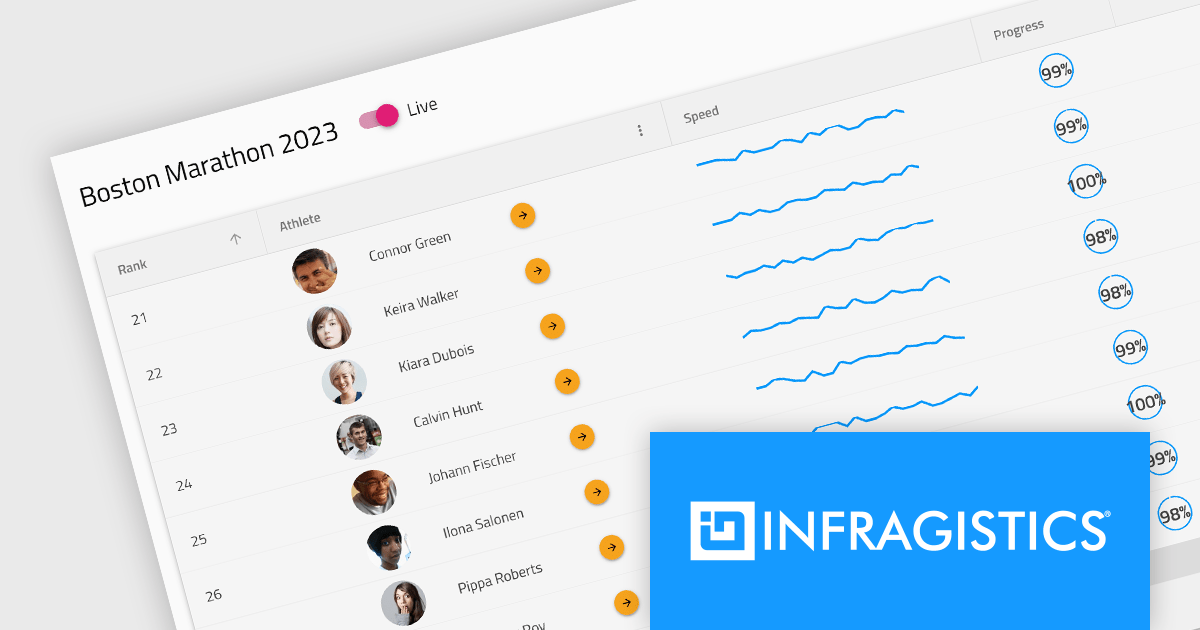
Infragistics Professional 23.2 includes the new Ignite UI Angular Data Grid, a full-featured modern component designed to enhance your data visualization capabilities. The grid boasts a rich set of features including data editing, selection, filtering, sorting, grouping, pinning, paging, templating, column moving, and exporting. This latest release brings even more functionality with collapsible column groups, column hiding, pinning, reordering, and moving capabilities. For customization, conditional styling allows for tailored aesthetics at the row or cell level. Advanced editing is empowered by a powerful API for Angular CRUD operations, and the grid also supports export to Excel, advanced filtering, and live data with real-time updates. These features, along with many more, provide a robust solution for all your data grid needs.
Infragistics Professional is licensed per developer and is available as a Perpetual License with a 1, 2 or 3 year support and maintenance subscription. See our Infragistics Professional licensing page for full details.
The Ignite UI for Angular Data Grid is available in the following products:

Kendo UI by Telerik is a comprehensive suite of JavaScript UI components offered in versions for jQuery, Angular, React, and Vue. It provides developers with over 110 pre-built widgets and tools to streamline the creation of modern, responsive, and feature-rich web applications, while maintaining a consistent API and theming across frameworks for a cohesive user experience.
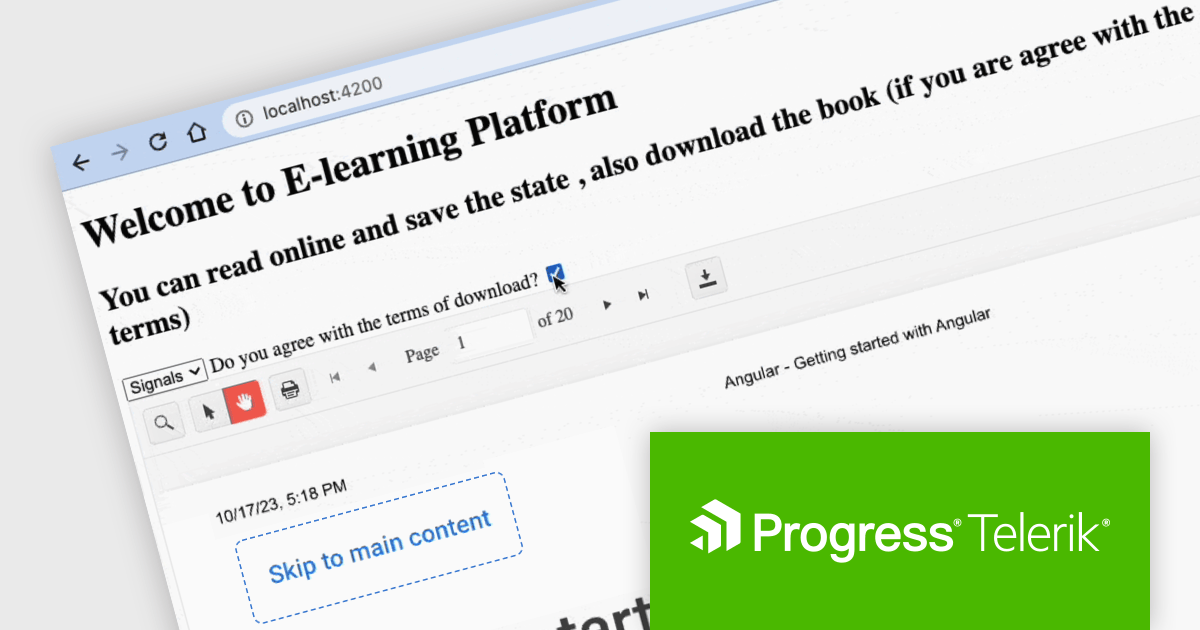
This Telerik blog post by Dany Paredes explains how to integrate the Kendo UI Angular PDF Viewer into your web applications and customize how users interact with PDFs, enhancing the user experience or even restricting downloads in specific scenarios. Steps include:
Kendo UI for Angular PDFViewer provides out-of-the-box functionalities like toolbar customization and event handling, allowing you to quickly build a feature-rich PDF Viewer with minimal code.
View the full blog to learn these valuable techniques.
Kendo UI is licensed per developer and is available as a perpetual license with a 1 year support subscription, which is available in 3 tiers: Lite, Priority or Ultimate. See our Kendo UI licensing page for full details.
Kendo UI is available to buy in the following products:

Sencha Ext JS is a comprehensive JavaScript framework for building data-intensive, cross-platform web and mobile applications for any modern device. Ext JS includes 140+ pre-integrated and tested high-performance UI components such as HTML5 calendar, grids, pivot grid, D3 adapter, trees, lists, forms, menus, toolbars, panels, windows, and much more.
In this blog post by Sencha Sales Engineer Andres Villalba you will learn the steps to use the power of ChatGPT to unlock your Ext JS potential. This includes:
The article also links to a recording of Andres's full session at JS Days, so you can watch as he takes you through the process, step by step.
Read the complete blog and find out how to save development time when building your next Ext JS JavaScript with ChatGPT.
Sencha Ext JS is available in Pro, Enterprise and Ultimate editions, as Annual Subscription or Perpetual Licenses. See our Sencha Ext JS licensing page for full details.
For more information, see our Sencha Ext JS product page.

Handsontable is a JavaScript library designed to help developers build interactive data grids into their web applications. Offering a familiar spreadsheet-like interface, it allows users to edit, sort, and filter data with ease. Highly customizable and compatible with popular frameworks like React and Angular, Handsontable empowers developers to build robust data manipulation features into their web applications.
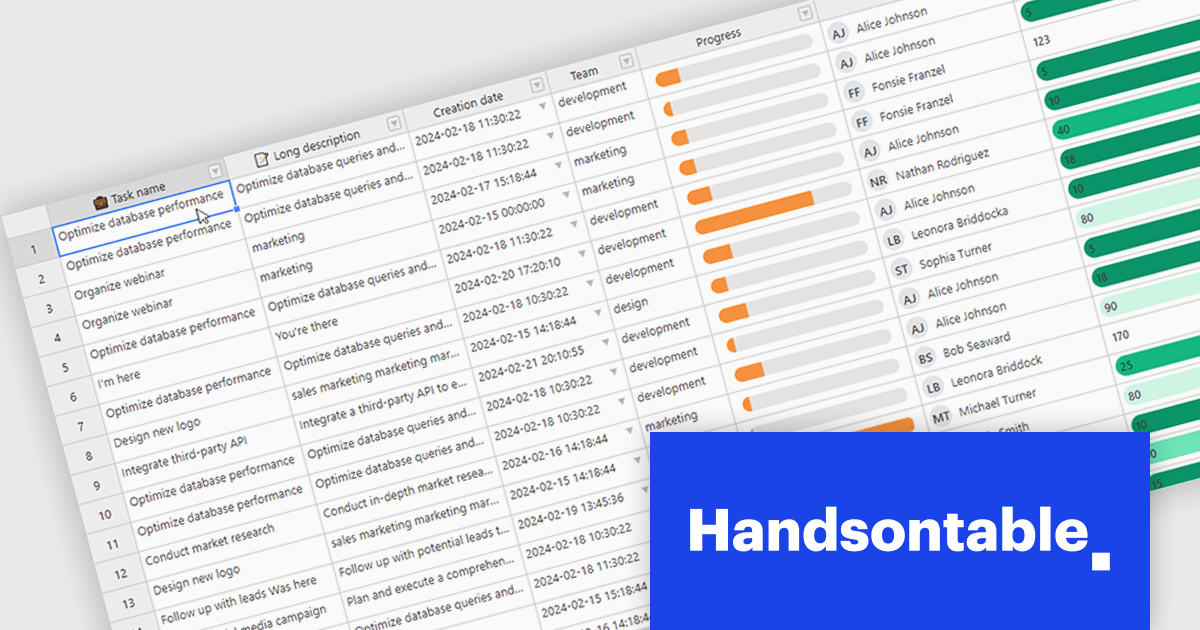
Handsontable 14.2.0 improves cell re-rendering using the React wrapper. The wrapper now uses memoization to optimize performance during user interactions like cell editing or scrolling in the grid, allowing the wrapper to remember the previous state and only update the elements that have actually changed. This smarter approach results in a smoother and more stable experience in your Handsontable apps, especially for complex custom cell types.
To see a full list of what's new in version 14.2.0, see our release notes.
Handsontable is licensed per developer and is available as an Annual or Perpetual license with 1 year support and maintenance. See our Handsontable licensing page for full details.
For more information, visit our Handsontable product page.

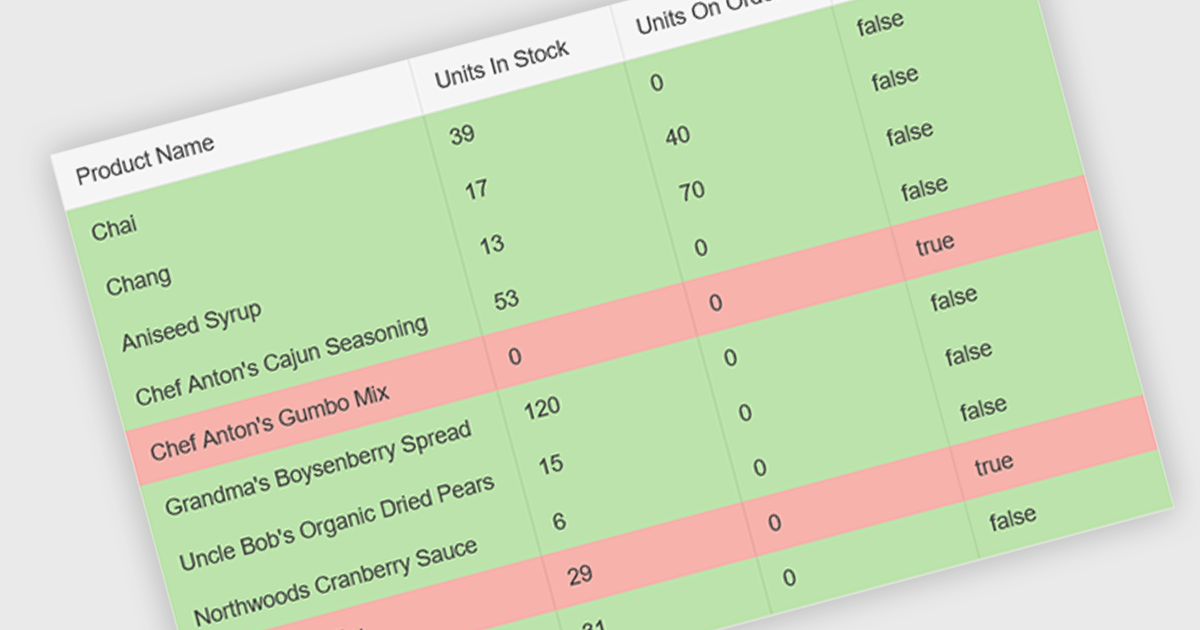
Conditional formatting in a grid allows you to dynamically alter the visual style of cells based on specific criteria within your data. This functionality enhances readability and user experience by highlighting important information. For instance, negative values can be displayed in red, exceeding values in bold, and empty cells with a light gray background, all within the grid itself. This reduces the need for users to manually scan through data and immediately draws attention to critical elements.
Several React grid controls offer conditional formatting, including:
For an in-depth analysis of features and price, visit our comparison of React Grid controls.