


Official Supplier
As official and authorized distributors, we supply you with legitimate licenses directly from 200+ software publishers.
See all our Brands.
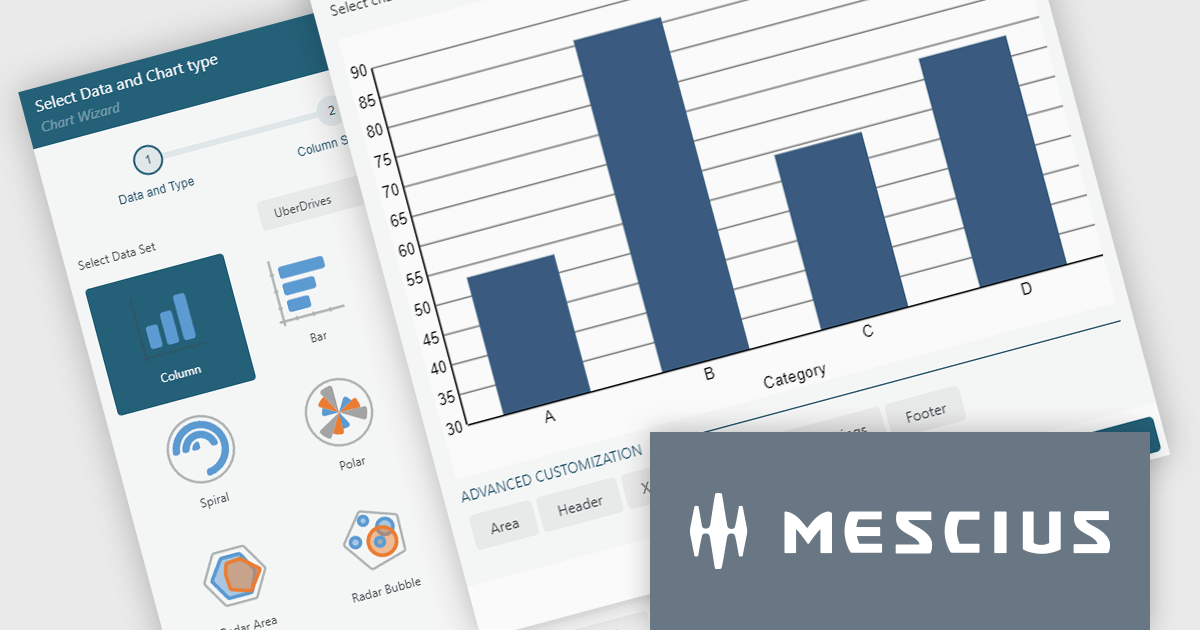
ActiveReportsJS by MESCIUS is a JavaScript reporting toolkit that empowers developers to design and embed interactive reports within web applications. It offers a standalone report designer for crafting reports and a JavaScript report viewer component for seamless integration into web frameworks like React or vanilla JavaScript. This solution streamlines report creation, facilitates data visualization, and delivers a user-friendly report experience.
The ActiveReportsJS 5.2 update introduces a completely revised chart report item, offering greater flexibility and control over data visualization. With enhanced configurability, developers can now customize data binding, axis settings, labels, and legends using dynamic expressions, allowing for more precise and adaptable chart designs. Additionally, seamless migration ensures that existing charts are automatically converted to the new model when older reports are opened in the designer, eliminating the need for manual adjustments. These improvements simplify chart configuration and make it easier to create clear and insightful reports.
To see a full list of what's new in 5.2, see our release notes.
ActiveReportsJS is licensed on an annual subscription or perpetual basis and is available as a Single Deployment License for non-commercial use, and as a Single Domain License or Unlimited Domain License for commercial and/or SaaS use. See our ActiveReportsJS licensing page for full details.
Learn more on our ActiveReportsJS product page.
Kendo UI by Telerik is a comprehensive suite of JavaScript UI components designed to accelerate web application development. Offering pre-built, customizable elements for grids, charts, schedulers, and more, it streamlines UI creation across popular frameworks like jQuery, Angular, React, and Vue. Key features include responsive design, accessibility, and high performance, enhancing user experience. Developers benefit from reduced development time, consistent UI patterns, and the ability to build feature-rich applications faster.
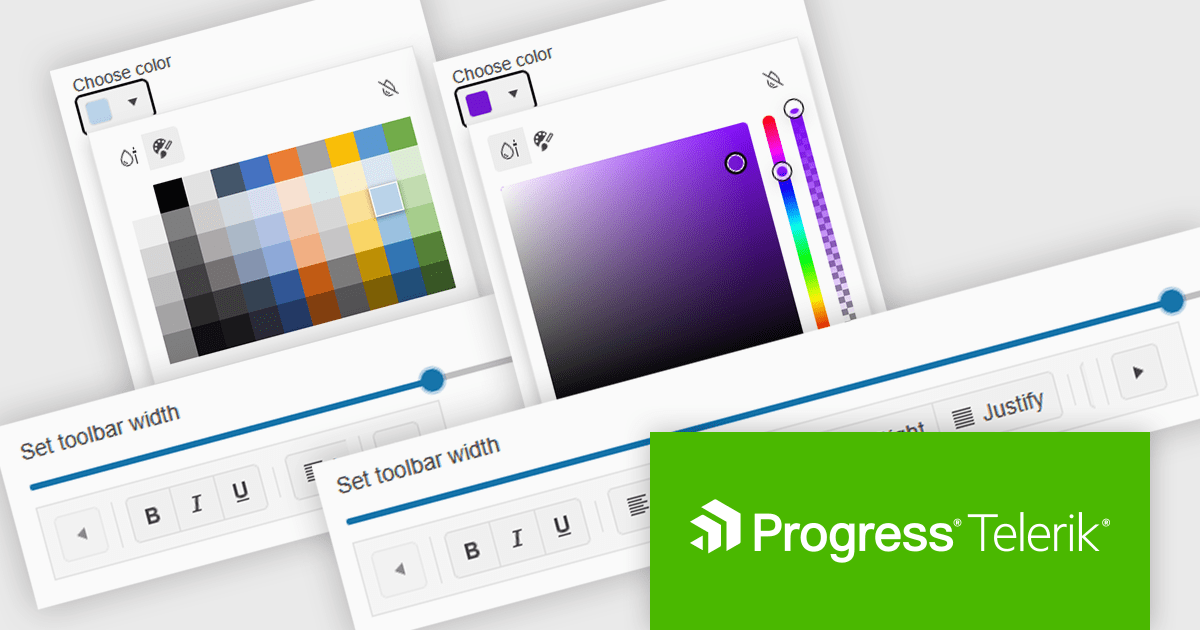
The Kendo UI for Angular (v18.1.0) update (part of Kendo UI 2025 Q1) introduces Adaptive Mode, enabling the ColorPicker, TabStrip, and Toolbar to dynamically adjust their rendering based on screen size, ensuring a seamless user experience across devices. This enhancement allows developers to deliver responsive and accessible interfaces without manual adjustments, as components automatically adapt to available space. The ColorPicker now presents a mobile-friendly action sheet for streamlined color selection, the TabStrip enables horizontal scrolling when tabs exceed container limits, and the Toolbar ensures tools remain accessible by intelligently managing overflow. By integrating Adaptive Mode, developers can simplify UI design, enhance usability, and improve cross-device consistency with minimal effort.
To see a full list of what's new in 2025 Q1 (v18.1.0), see our release notes.
Kendo UI is licensed per developer and has two licensing models: an annual Subscription License and a Perpetual License. The Subscription license provides access to the latest product updates, technical support, and exclusive benefits for a flat annual fee, and must be renewed to continue using the software. The Perpetual license is a one-time purchase granting access to the current released version and includes a one-year subscription for product updates and technical support. After this initial period, users can choose to renew the subscription element to continue receiving updates and support; otherwise, they may continue using the installed version available during their active subscription term but will forgo future updates and support. See our Kendo UI licensing page for full details.
Kendo UI is available individually or as part of the following products:
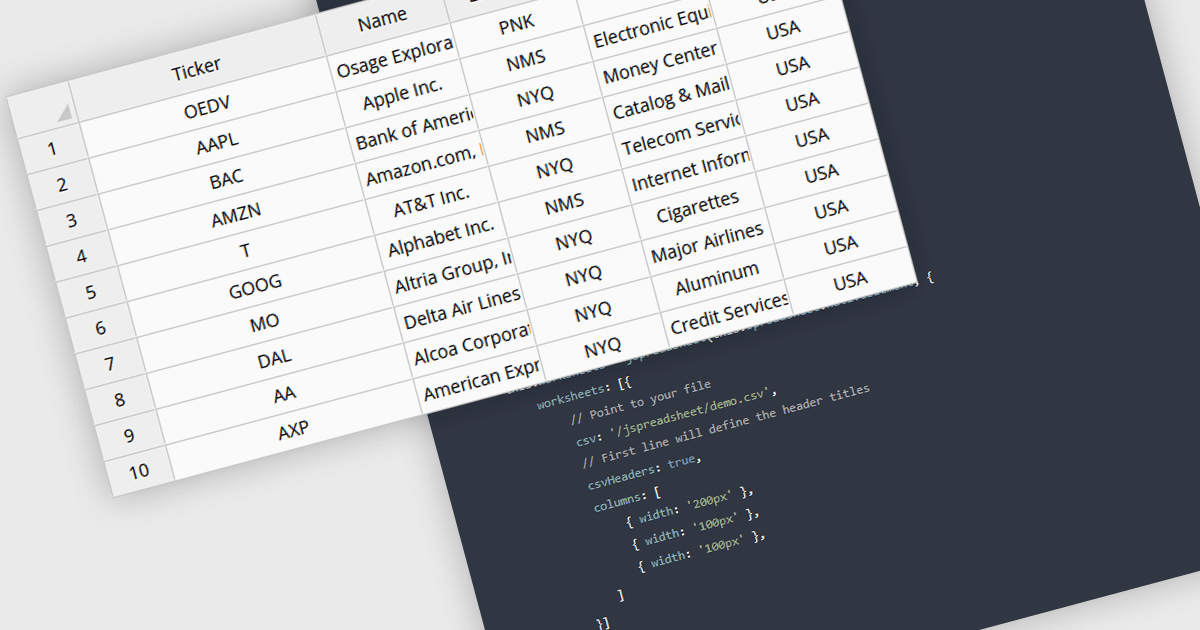
Grid controls with CSV/TSV data source support enable developers to seamlessly import, parse, and display structured tabular data from comma-separated or tab-separated files. This functionality simplifies data integration by eliminating the need for complex preprocessing, allowing users to work with large datasets efficiently. It enhances usability by providing built-in parsing mechanisms, automatic column detection, and flexible data binding, ensuring smooth interoperability with various data formats. By reducing manual effort and improving performance, this feature streamlines data-driven application development, making it easier to present, edit, and manipulate structured information within web-based interfaces.
Several Angular grid controls offer using CSV/TSV as a data source including:
For an in-depth analysis of features and price, visit our comparison of Angular grid controls.
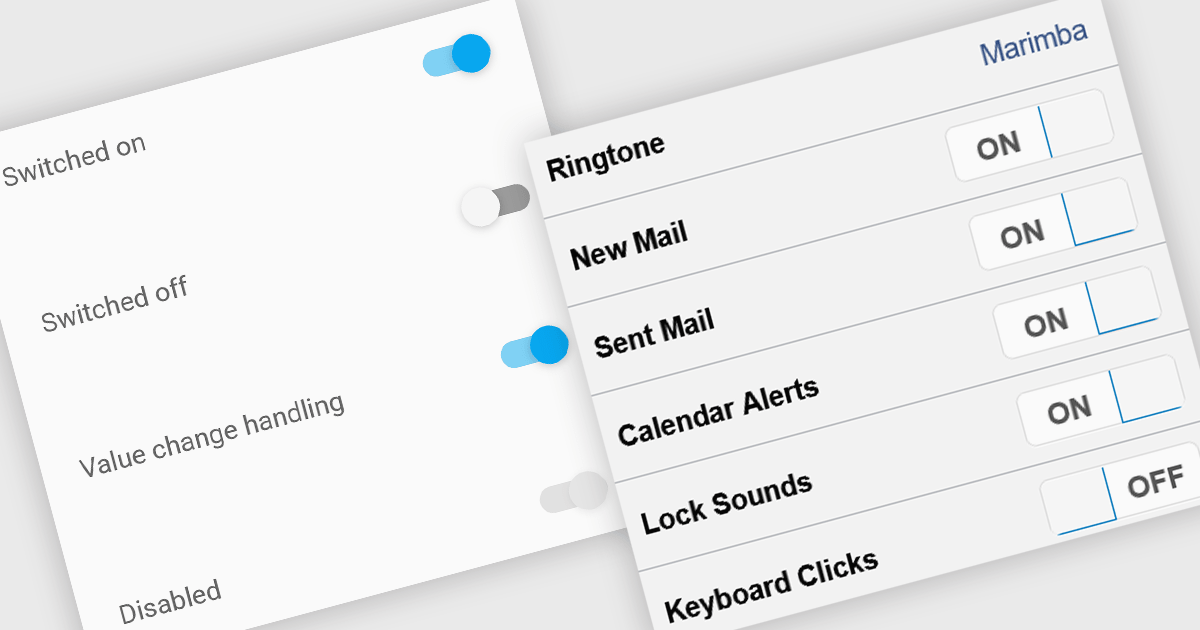
Toggle switches in data editor components provide a user-friendly way to manage boolean values, offering a clear on/off representation that enhances usability. These switches replace traditional checkboxes with a more modern and intuitive interface, making them particularly useful for mobile and web applications where quick interactions are essential. By improving clarity and reducing user errors, toggle switches contribute to a smoother and more efficient data entry experience.
Several Vue.js data editor collections offer toggle switch controls including:
For an in-depth analysis of features and price, visit our Vue.js data editors comparison.
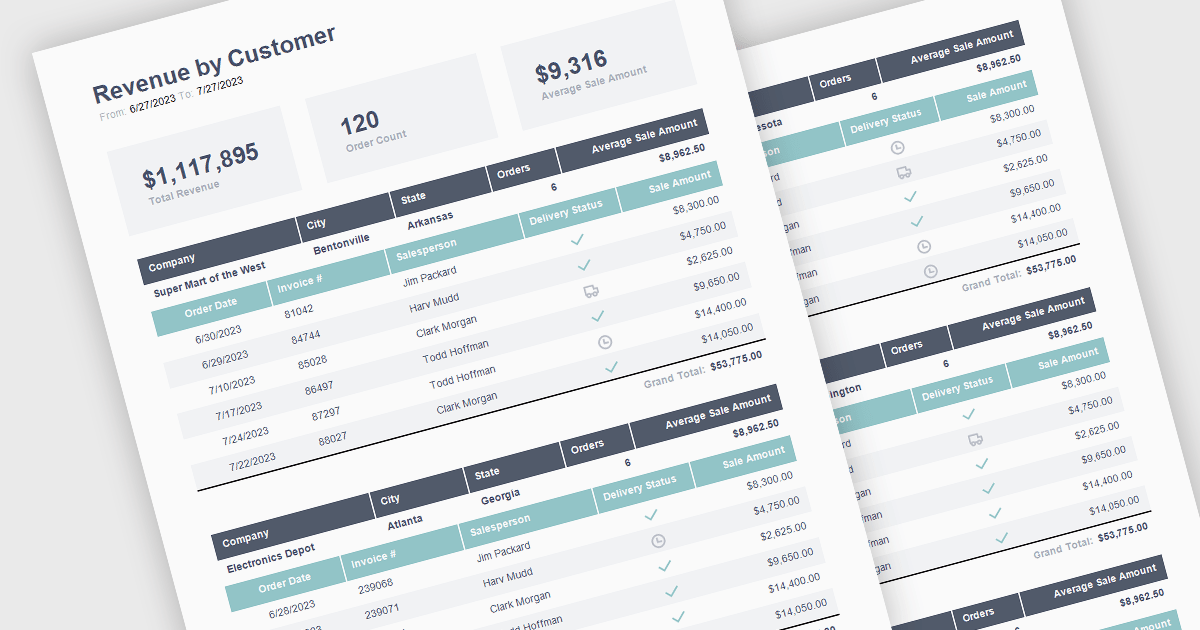
The ability to summarize and aggregate information in a report provides a means of condensing extensive data sets to form part of a concise and meaningful overview of the report's contents. This feature highlights key insights, eliminating the need for readers to sift through raw data. Aggregation processes the data mathematically through calculations such as totals, averages, percentages, means, or medians to identify patterns and trends. By highlighting and summarizing the report's findings in this way, this feature consolidates complex information in a way that aides the reader in identifying patterns and interpreting the data.
The following React reporting components support summaries and aggregates:
For an in-depth analysis of features and price, visit our comparison of React reporting components.


Tel: (888) 850 9911
Fax: +1 770 250 6199


