


Official Supplier
As official and authorized distributors, we supply you with legitimate licenses directly from 200+ software publishers.
See all our Brands.

OrgChart JS by BALKAN App is a JavaScript library designed for creating flexible, interactive and customizable organizational charts for presenting structural data. This visual tool helps managers illustrate the roles and hierarchy of an organization, supporting a variety of features, including grouping, assistant nodes, expand/collapse, a built-in search field, and multi-format exports for example to PDF, PNG, SVG or CSV. Compatible with all modern browsers, it supports thousands of nodes without any impact on performance, and offers extensive customization, giving users a versatile and efficient tool for visualizing hierarchical data structures in web applications.
The OrgChart JS v8.15 update introduces AI capabilities that enhance the creation and management of organizational charts. Developers can now utilize natural language commands to manipulate chart data, such as adding or moving employees, adjusting salaries and customizing visual elements. The integration of artificial intelligence improves the process of maintaining accurate and efficient organizational charts within applications.
To see a full list of what's new in v8.15, see our release notes.
OrgChart JS is licensed based on usage, offering single website, unlimited websites or SaaS, and OEM licenses. It is available as a perpetual license with 1 year maintenance and technical support. See our OrgChart JS licensing page for full details.
For more information, see our OrgChart JS product page.
KendoReact by Telerik is a comprehensive library of UI components specifically designed for building modern, feature-rich React applications, enabling developers to create intuitive, responsive, and visually appealing interfaces with ease. It includes robust components like data grids, charts, form elements, and navigation tools, optimized for high performance with features such as virtualization for large datasets and adherence to accessibility standards. Ideal for dashboards, enterprise apps, and data-driven applications, KendoReact empowers teams to accelerate development, ensure design consistency, and deliver inclusive user experiences.
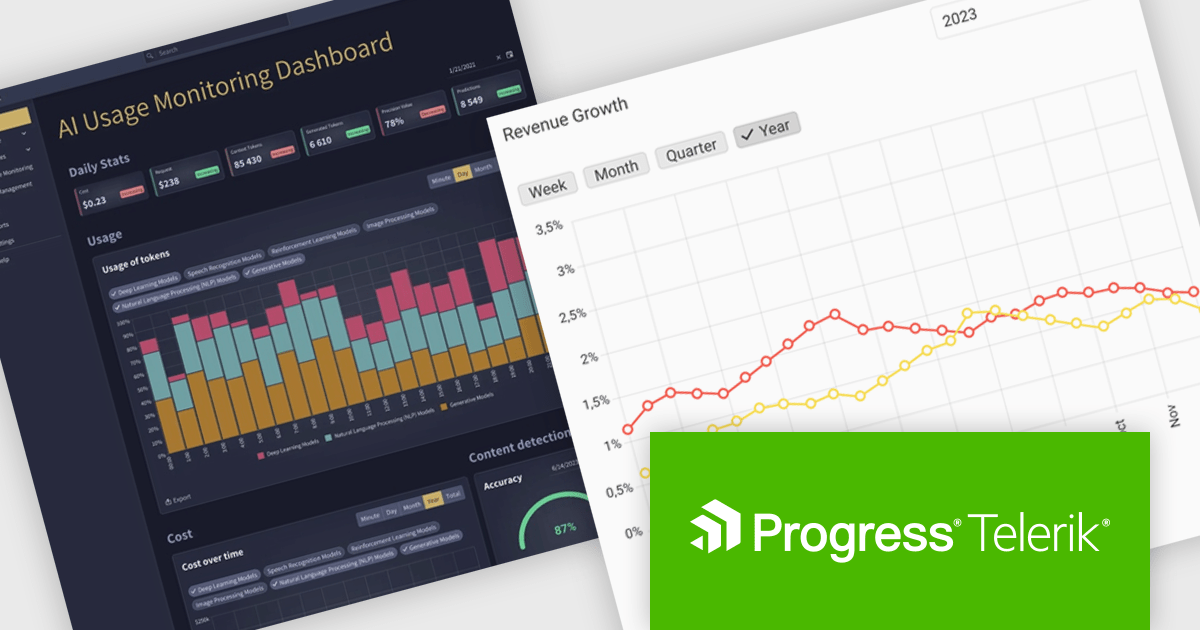
The KendoReact v9.4.0 update enhances UI development efficiency by introducing 12 new Building Blocks, including Dashboard Cards, an AI App Welcome Screen, an AI-powered Editor, and an AI Usage Monitoring Dashboard Template. These pre-configured components, seamlessly integrated with KendoReact, enable developers to accelerate application design, maintain consistency, and reduce implementation effort. By leveraging these ready-to-use elements, teams can focus on building functionality rather than UI assembly, ensuring faster delivery of modern, AI-driven applications with a polished user experience.
To see a full list of what’s new in 2025 Q1 (v9.4.0), see our release notes.
KendoReact is licensed per developer and has two licensing models: an annual Subscription License and a Perpetual License. The Subscription license provides access to the latest product updates, technical support, and exclusive benefits for a flat annual fee, and must be renewed to continue using the software. The Perpetual license is a one-time purchase granting access to the current released version and includes a one-year subscription for product updates and technical support. After this initial period, users can choose to renew the subscription element to continue receiving updates and support; otherwise, they may continue using the installed version available during their active subscription term but will forgo future updates and support. See our KendoReact licensing page for full details.
KendoReact is available individually or as part of the following products:
SurveyJS is a family of extensible JavaScript libraries designed to help developers build robust form management systems fully integrated into their web applications. These libraries work seamlessly with any backend system and are fully compatible with modern JavaScript frameworks, including React, Angular, and Vue 3.
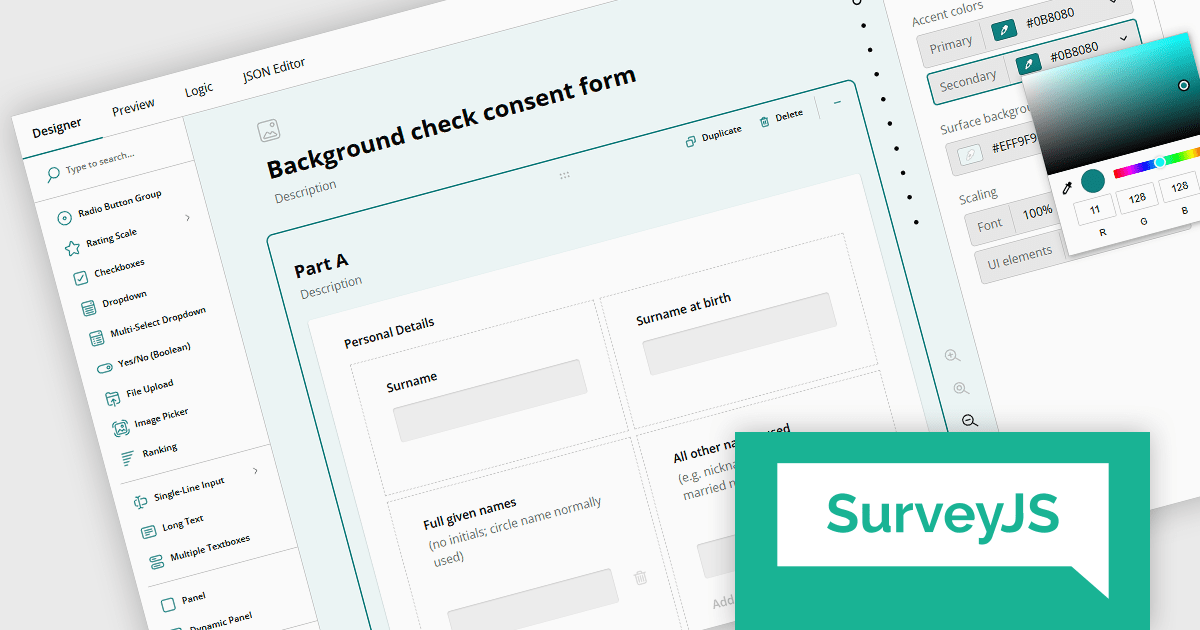
SurveyJS Survey Creator is a powerful form-building UI component featuring an intuitive drag-and-drop interface that makes form creation accessible to all users. Its UI is fully customizable - from appearance and functionality to the UI language - allowing it to seamlessly blend into your application. Behind the scenes, SurveyJS leverages a JSON-based schema to define forms and surveys, making it easy to store, share, and dynamically render form structures across different environments.
Users can enjoy an intuitive survey-building experience with extensive UI customization options, available through a dedicated UI settings panel. Introduced in version 2.0 the settings panel includes three new predefined UI themes - Light, Dark, and Contrast (with WCAG 2.2-compliant colors). These themes can be used as-is or further customized with options for UI and font scale size, accent colors, and background colors. Along with other enhancements these UI options create a more flexible environment where each user can personalize the form builder UI to align perfectly with their personal preferences.
SurveyJS Survey Creator is licensed per developer with a one-time payment for indefinite use. Access to updates and technical support is available through a subscription. See our SurveyJS Survey Creator licensing page for full details.
Learn more on our SurveyJS Survey Creator product page.
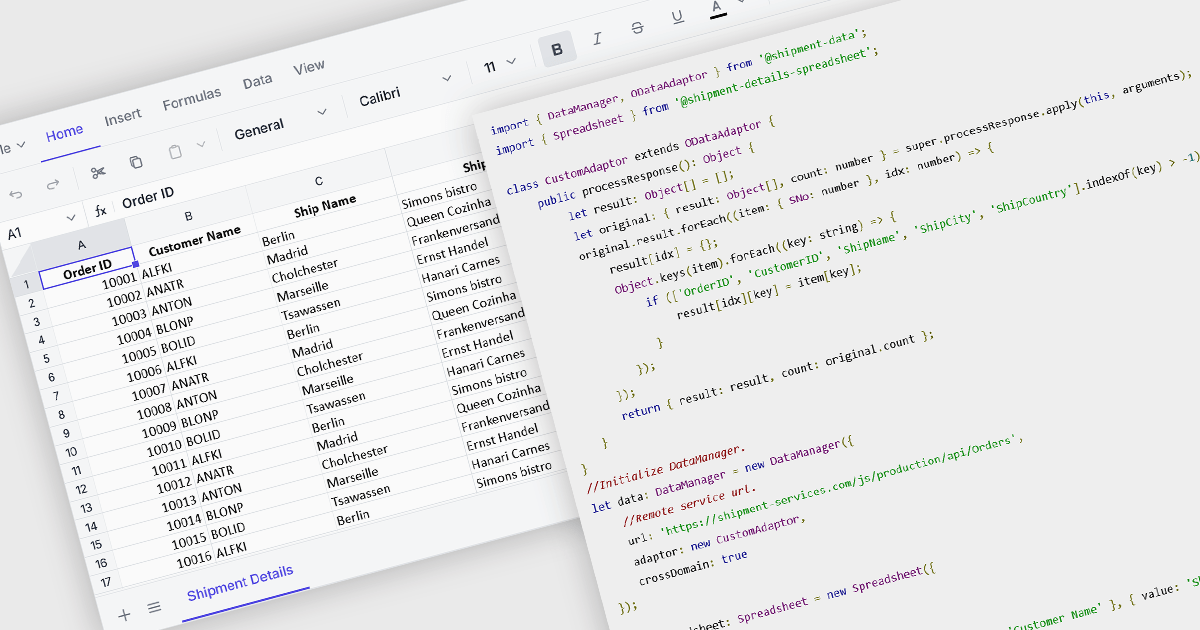
Data binding in a spreadsheet is the process of linking spreadsheet cells to external data sources, such as databases, APIs (Application Programming Interfaces), or other structured datasets, ensuring that the spreadsheet dynamically updates when the source data changes. This enables real-time synchronization, reducing manual data entry and minimizing errors. By automating data retrieval and updates, data binding enhances accuracy, supports complex calculations with live data, and improves efficiency, making it particularly useful for reporting, financial analysis, and business intelligence tasks. It also facilitates better collaboration by ensuring that all users work with the most current information, improving decision-making and overall productivity.
Several Vue.js spreadsheet components offer data binding functionality, including:
For an in-depth analysis of features and price, visit our Vue.js spreadsheet controls comparison.
Effective data processing and presentation features are an essential part of modern reporting components, enabling users to organize, analyze, and display data in a meaningful way. These capabilities transform raw information into structured, interactive reports that support better decision-making. By allowing users to manipulate data dynamically, apply business rules, and customize the way information is displayed, these features ensure reports remain relevant, insightful, and easy to interpret across different use cases.
Common features include:
For an in-depth analysis of features and price, visit our Vue.js Reporting controls comparison.


Tel: (888) 850 9911
Fax: +1 770 250 6199


