


Official Supplier
As official and authorized distributors, we supply you with legitimate licenses directly from 200+ software publishers.
See all our Brands.
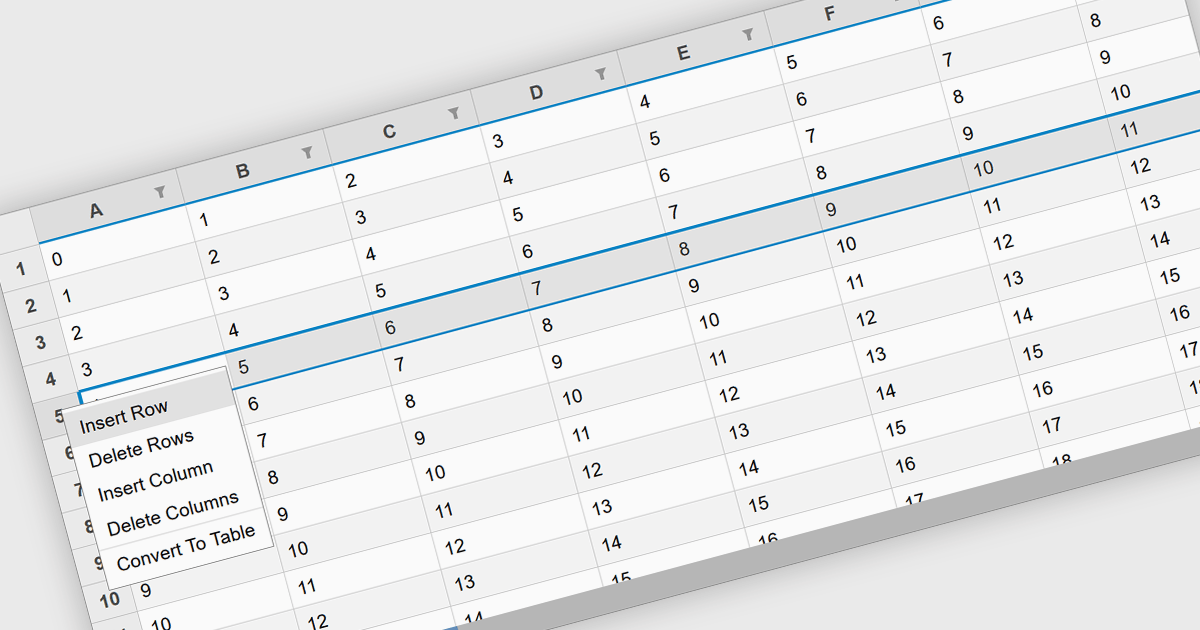
Inserting rows in spreadsheet components is a fundamental feature that allows users to dynamically expand their data sets while maintaining structure and organization. This capability is essential for applications that handle tabular data, enabling seamless modifications without disrupting existing content. Whether used for financial calculations, data analysis, or collaborative editing, the ability to add rows programmatically or through user interaction enhances flexibility and efficiency in spreadsheet-based applications.
Several React spreadsheet controls offer support for inserting rows including:
For an in-depth analysis of features and price, visit our React spreadsheet controls comparison.
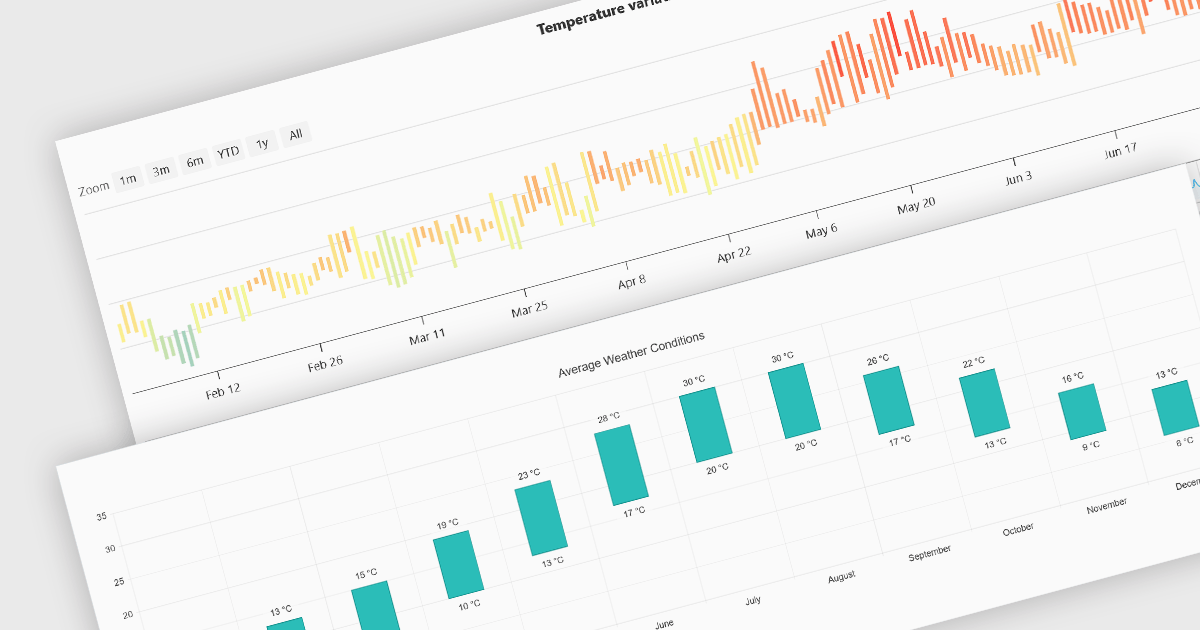
Range bar charts provide a way to visualize data that includes both minimum and maximum values. The bars displayed represent a value range, spanning between the minimum and maximum levels, rather than a single point. This type of chart makes it easier for users to compare variations across different categories or time periods, detect anomalies, and identify trends. This makes them particularly useful for scenarios where understanding variations within a range is important, such as stock price fluctuations, project timelines, or performance metrics. Their structured layout improves readability, making them a valuable tool in financial analysis, scheduling, and business intelligence applications.
Several Angular charting components provide you with range bar charts, including:
For an in-depth analysis of features and price, visit our Angular chart controls comparison.
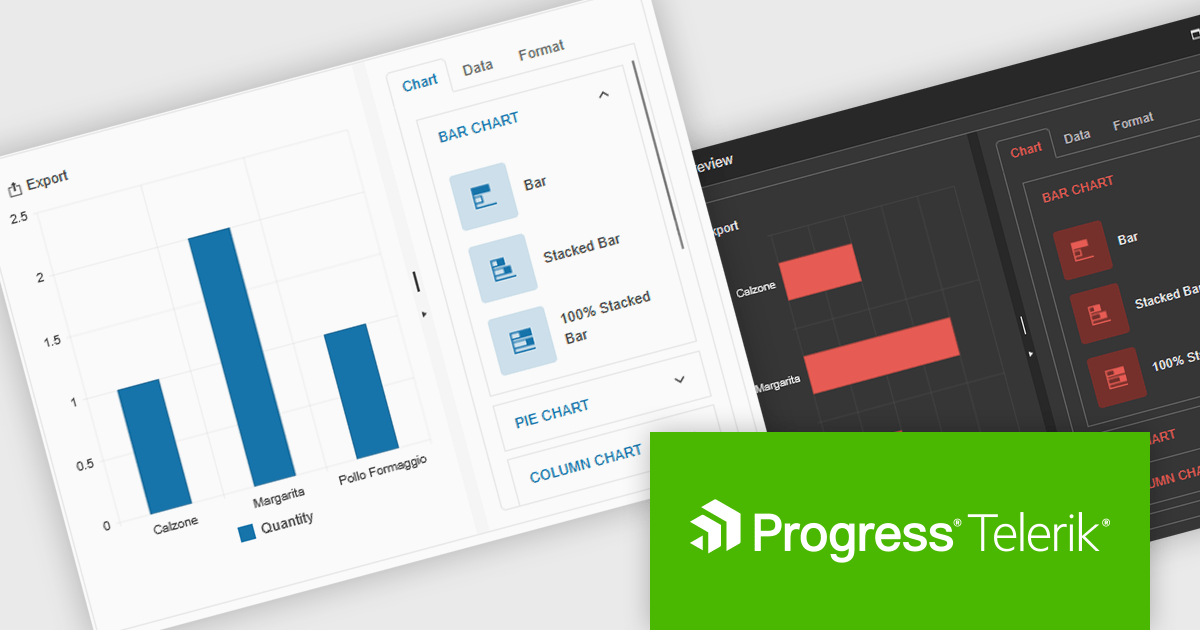
Kendo UI by Telerik is a comprehensive suite of JavaScript UI components designed to accelerate web application development. Offering pre-built, customizable elements for grids, charts, schedulers, and more, it streamlines UI creation across popular frameworks like jQuery, Angular, React, and Vue. Key features include responsive design, accessibility, and high performance, enhancing user experience. Developers benefit from reduced development time, consistent UI patterns, and the ability to build feature-rich applications faster.
The Kendo UI for jQuery v2025 Q1 update introduces the Chart Wizard, a streamlined tool that simplifies chart creation by allowing developers to generate data-driven visualizations directly from grids, data-bound components, or external sources. This feature reduces manual configuration, enhances workflow efficiency, and ensures a seamless integration process, enabling developers to quickly transform raw data into meaningful insights while maintaining full customization control.
To see a full list of what’s new in v17.1.0 (2025 Q1), see our release notes.
Kendo UI is licensed per developer and has two licensing models: an annual Subscription License and a Perpetual License. The Subscription license provides access to the latest product updates, technical support, and exclusive benefits for a flat annual fee, and must be renewed to continue using the software. The Perpetual license is a one-time purchase granting access to the current released version and includes a one-year subscription for product updates and technical support. After this initial period, users can choose to renew the subscription element to continue receiving updates and support; otherwise, they may continue using the installed version available during their active subscription term but will forgo future updates and support. See our Kendo UI licensing page for full details.
Kendo UI is also available to buy individually or as part of:

Stimulsoft Reports.PYTHON provides a collection of tools for creating, viewing, exporting, and printing reports within your Python applications. It allows you to connect to various data sources and leverage client-server technology for efficient report generation. Additionally, Stimulsoft offers powerful features for visualizing and analyzing your data.
The Stimulsoft Reports.PYTHON 2025.1.1 update introduces a new Export List Settings feature, allowing users to streamline the export options available in the Viewer. By using the new "Hide Unlisted Exports in The Viewer" parameter, developers can define which export formats are visible in the Save menu for reports and dashboards. This provides greater control over the user interface, enabling a more focused and tailored experience while maintaining flexibility to align with specific project requirements. By default, all export formats remain accessible, ensuring compatibility with existing setups.
To see a full list of what's new in 2025.1.1, see our release notes.
Stimulsoft Reports.PYTHON is licensed per developer and is available as a Perpetual license with 1 year support and maintenance. See our Stimulsoft Reports.PYTHON licensing page for full details.
Stimulsoft Reports.PYTHON is available individually or as part of Stimulsoft Ultimate.

Converting a PDF into an image format like PNG, JPEG, or TIFF improves performance by allowing documents to load instantly without requiring a dedicated PDF viewer. This is particularly useful for web applications, where rendering a full PDF can be slow and resource-intensive. Additionally, converting PDFs to images enhances security by preventing direct text extraction or modification, ensuring sensitive content remains intact. It also simplifies embedding and sharing, making documents more accessible across different devices and platforms. These benefits make PDF-to-image conversion a practical choice for optimizing document handling in modern applications.
Several PDF controls offer PDF to image conversion support including:
For an in-depth analysis of features and price, visit our JavaScript PDF controls comparison.


Tel: (888) 850 9911
Fax: +1 770 250 6199


