


Official Supplier
As official and authorized distributors, we supply you with legitimate licenses directly from 200+ software publishers.
See all our Brands.
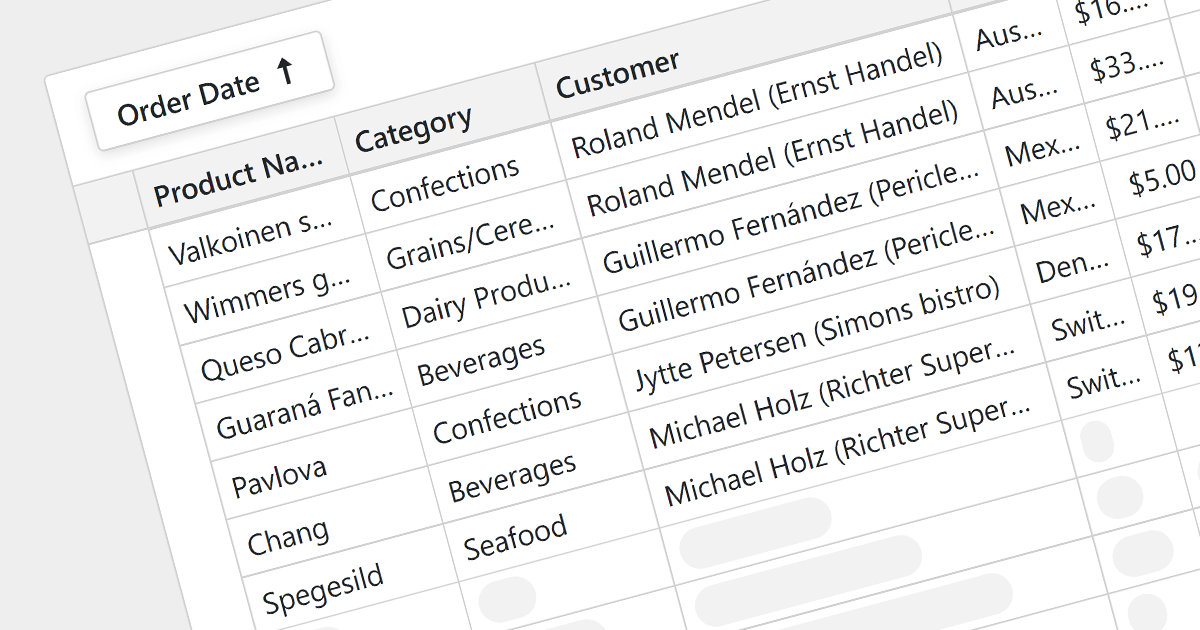
For large datasets, traditional grid scrolling struggles to maintain performance, often becoming sluggish and resource-intensive. Virtual scrolling provides a more efficient alternative. Instead of rendering the entire dataset at once, it dynamically fetches and displays only the visible rows, keeping the rest cached and unloaded. This significantly reduces the number of elements in the application, resulting in a noticeably smoother scrolling experience, even with millions of data points. Virtual scrolling empowers users to seamlessly explore expansive datasets without compromising performance or responsiveness.
Several Blazor grid components support virtual scrolling including:
For an in-depth analysis of features and price, visit our Blazor grids comparison.
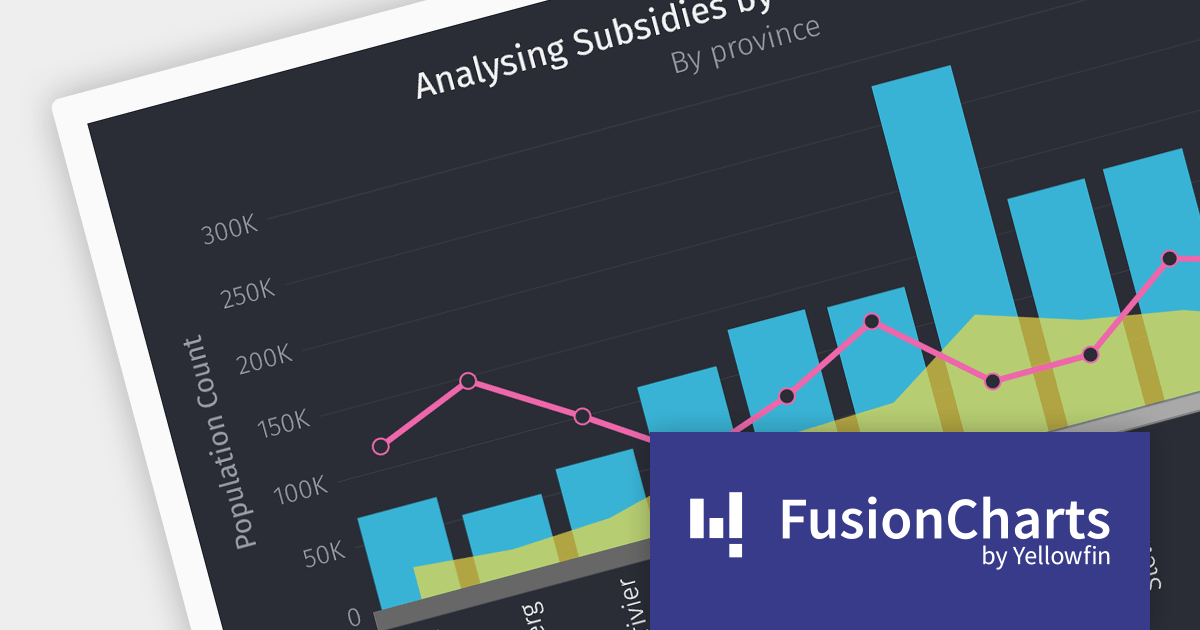
FusionCharts Suite XT is a powerful collection of charting and mapping tools that helps developers create interactive and data-driven dashboards for their web and mobile applications. It provides a wide range of features, including over 100 chart types, data-driven maps, and a variety of customization options. FusionCharts Suite XT helps you visualize and present data in a clear and engaging way.
The FusionCharts Suite XT v3.22 release introduces seamless integration with Blazor, allowing you to create visually appealing and informative data visualizations that enhance the overall user experience. These visualizations offer feature-rich configuration options that boost charting performance, enabling efficient client-side rendering and fast chart display, even with large datasets.
To see a full list of what's new in v3.22, see our release notes.
For more information, visit our FusionCharts Suite product page.
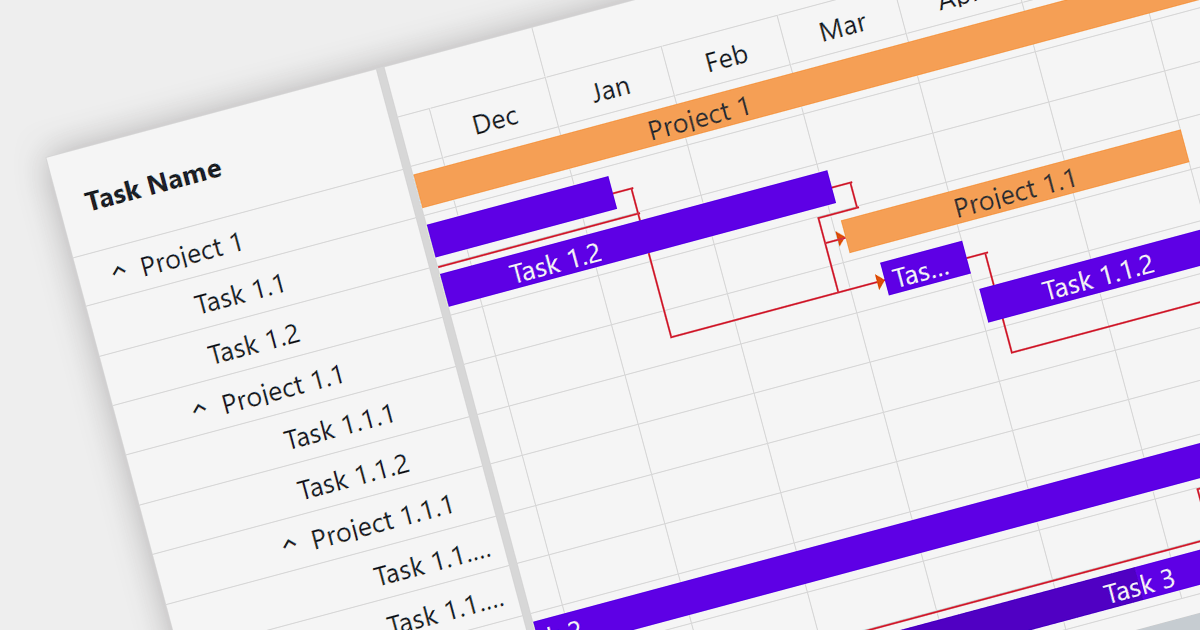
Gantt charts are a type of bar chart designed to illustrate project schedules. They display the start and end dates of different elements of a project and are essential for project management. These charts are useful for tracking project progress and for planning by showing how project tasks overlap and relate to each other.
Several Blazor chart components provide Gantt charts including:
For an in-depth analysis of features and price, visit our Blazor Charts comparison.
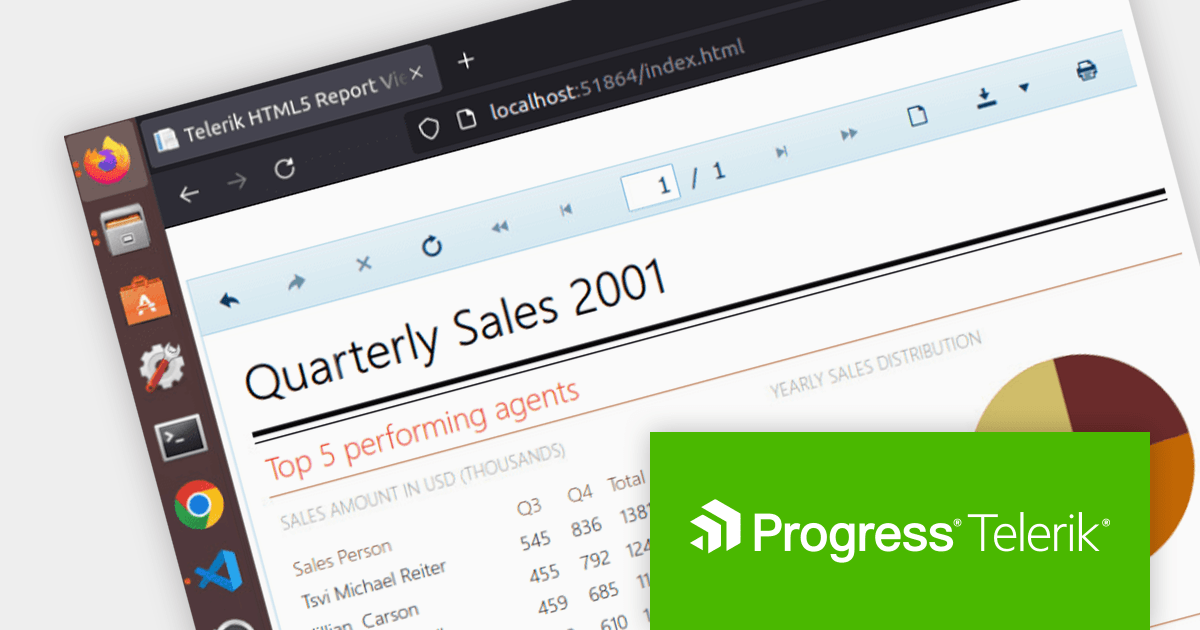
Telerik Reporting is a comprehensive and lightweight embedded reporting tool for .NET web and desktop applications. It enables developers and reporting users to create, design, and export visually appealing, interactive, and reusable reports to effectively present analytical and business data. It supports various technologies, including ASP.NET Core, Blazor, ASP.NET MVC, ASP.NET AJAX, HTML5/JS, Angular, WPF, WinForms, and WinUI.
Telerik Reporting R3 2023 SP1 introduces SkiaSharp-based rendering for Microsoft Word, Excel and PowerPoint documents. SkiaSharp is a 2D graphics API for .NET, based on Google's Skia Graphics Library. This cross-platform API means your rendered documents will look the same on all platforms that support it, such as Microsoft Windows, Apple macOS/iOS, Android, and Linux. SkiaSharp can leverage the hardware acceleration capabilities of modern devices so your reports will be rendered faster and more smoothly.
To see a full list of what's new in R3 2023 SP1, see our release notes.
Telerik Reporting is available to buy in the following products:
Telerik UI for Blazor is a comprehensive UI library that provides over 110 native Blazor components for building modern and feature-rich web applications. This professional-grade solution offers a complete set of components to satisfy all user interface requirements, saving time and effort in UI design.
Telerik UI for Blazor R3 2023 SP1 (v5.0.0) introduces the AppBar component, empowering developers to create personalized navigation bars that seamlessly integrate with their application's design. The AppBar is fully customizable with control over height, width, position, theme color, and layout, the ability to choose between sticky, fixed, or static behavior, and the option to define and reorder navigation items for an optimal navigation flow. The new component delivers a seamless and visually appealing navigation experience that allows users to effortlessly navigate your application, switch between screens, and maintain contextual awareness throughout their journey.
To see a full list of what's new in R3 2023 SP1 (v5.0.0), see our release notes.
Telerik UI for Blazor is available to buy in the following products:


Tel: (888) 850 9911
Fax: +1 770 250 6199


