


Official Supplier
As official and authorized distributors, we supply you with legitimate licenses directly from 200+ software publishers.
See all our Brands.

Infragistics Ignite UI for Blazor is a comprehensive UI component library designed specifically for .NET developers building modern web applications with Blazor. It offers a rich set of over 60 components, including performant data grids, interactive charts, and essential UI elements. This allows developers to craft visually appealing, feature-packed Blazor applications with a focus on data visualization, user interaction, and a variety of design themes.
Version 23.2.189 introduces the new hierarchical data grid. This intuitive component empowers you to present multi-level information in a clear, structured format. Bind your data with minimal coding, and leverage fine-grained control through various events. The grid boasts a rich feature set, including selection tools, advanced filtering and sorting options, all designed to enhance user experience by providing a more organized and interactive way to explore information.
To see a full list of what's new in version 23.2.189, see our release notes.
Infragistics Ignite UI for Blazor is part of Infragistics Ignite UI which is licensed per developer and is available as a Perpetual License with a 1, 2 or 3 year support and maintenance subscription. See our Infragistics Ignite UI licensing page for full details.
Infragistics Ignite UI for Blazor is available in the following products:
Syncfusion Essential Studio Blazor (available as part of Syncfusion Essential Studio Enterprise) is a comprehensive UI component library designed to accelerate the development of high-performance, modern web applications using the Blazor framework. It boasts over 85+ responsive, lightweight, and modular components spanning various categories like data visualization, data editing, document processing, and interactive UI elements. This rich repertoire empowers developers to rapidly build user-friendly, feature-rich web interfaces, all with the advantage of seamless integration with both server-side and client-side Blazor applications.
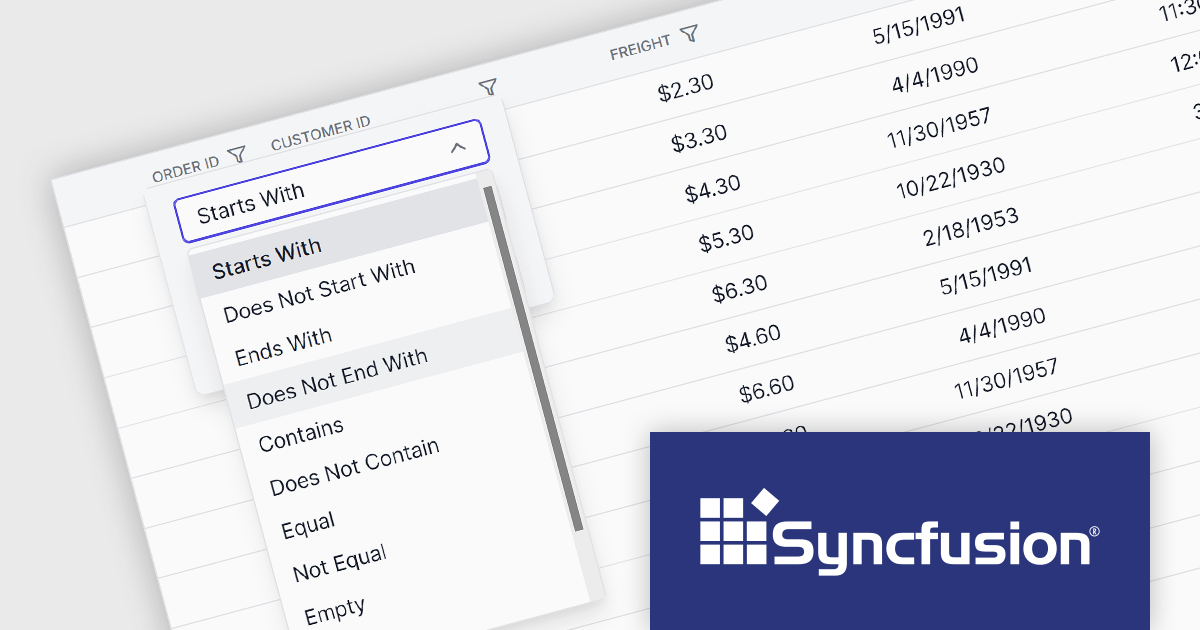
The Syncfusion Essential Studio Blazor 2024 Volume 1 (25.1.35) release introduces a new operator for its search and filter functionality. This addition empowers users with the ability to conduct more precise and targeted searches on their data. This enhanced functionality expands filtering capabilities to include options like "Does Not Contain," "Is Null," and "Does Not Start With," granting users greater flexibility and control over how they search and filter data within the DataGrid.
To see a full list of what's new in version 2024 Volume 1 (25.1.35), see our release notes.
Syncfusion Essential Studio Blazor is available as part of Syncfusion Essential Studio Enterprise which is licensed per developer starting with a Team License of up to five developers. It is available as a 12 Month Timed Subscription License which includes support and maintenance. See our Syncfusion Essential Studio Enterprise licensing page for full details.
For more information, visit our Syncfusion Essential Studio Blazor product page.
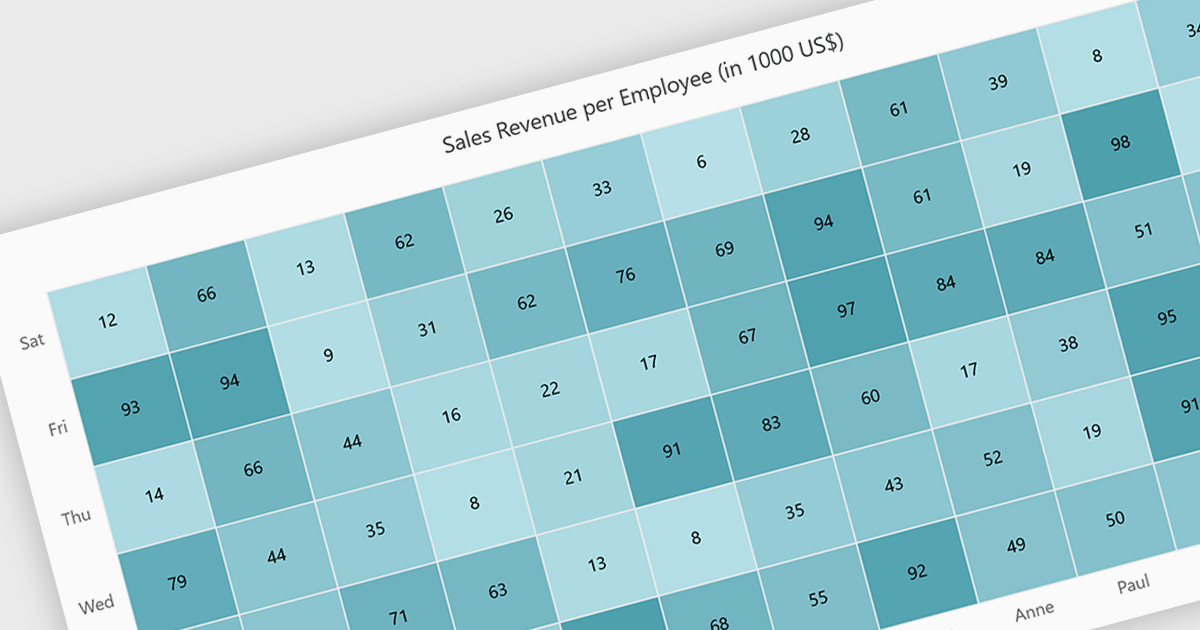
A heatmap is a data visualization tool that uses color intensity to represent magnitude within a dataset. This allows for quick identification of patterns and trends across two variables, depicted on the map's axes. Heatmaps are valuable for analyzing geographic data, user website interaction, and any other scenario where you need to visually grasp the distribution of data points.
Several Blazor chart controls offer Heatmaps including:
For an in-depth analysis of features and price, visit our Blazor chart controls comparison.
ActiveReports.NET is a reporting tool that allows developers to design and deliver reports with intuitive, reliable, and user-friendly report designers and controls. Features include the ability to create reports in a variety of formats, such as PDF, Excel, and HTML. ActiveReports.NET is also highly customizable, with an extensive API and advanced feature library.
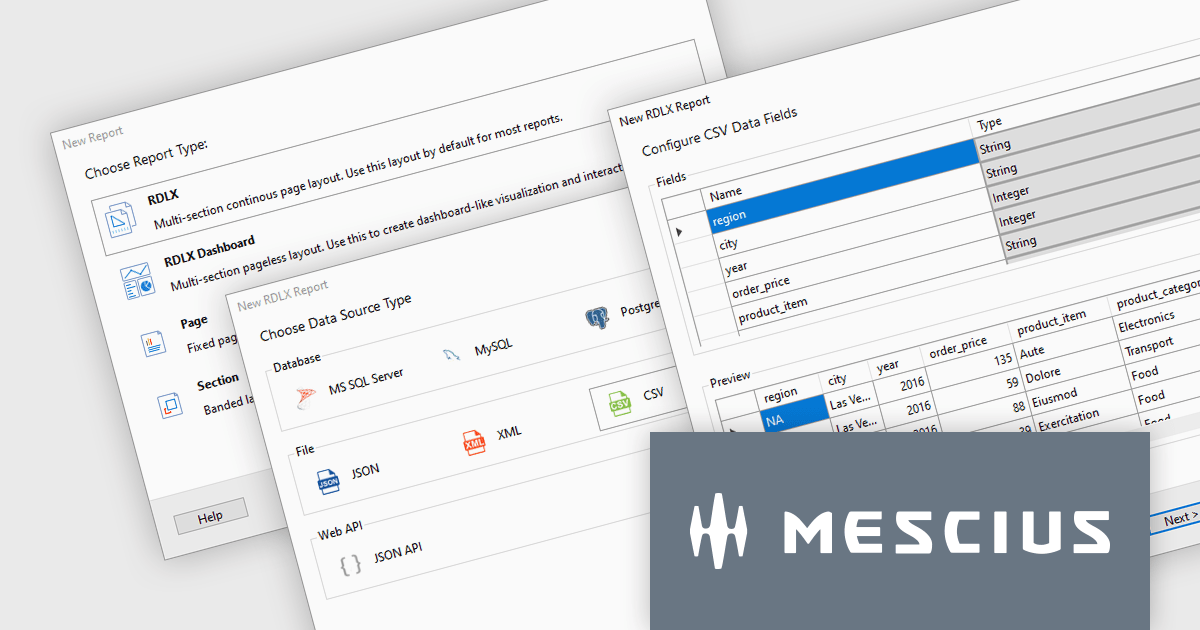
ActiveReports.NET v18 introduces a powerful Report Wizard to streamline the creation of RDLX, Page, and Dashboard reports. This intuitive wizard expertly guides you through the entire report design process, from initial configuration to seamless data binding. Whether you're crafting detailed financial reports, visually rich data dashboards, or any other type of document-based presentation, the wizard ensures a smooth experience. This new feature helps you transform raw data into clear, actionable insights with ease.
To see a full list of what's new in version 18, see our release notes.
ActiveReports.NET is licensed per developer and is available with or without a 12 month support and maintenance subscription. See our ActiveReports.NET licensing page for full details.
For more information, visit our ActiveReports.NET product page.

A range trackbar component, also known as a range slider, expands upon the standard trackbar by allowing users to select a range of values within a predefined minimum and maximum, instead of just a single point. This is achieved through two independent sliders or markers that define the lower and upper bounds of the chosen range. Range trackbars are commonly used in applications requiring filter selection, price range specification, or any scenario where choosing a continuous segment within a broader spectrum is necessary.
Several Blazor Data Editor controls offer range trackbars including:
For an in-depth analysis of features and price, visit our Blazor data editors comparison.


Tel: (888) 850 9911
Fax: +1 770 250 6199


