


Official Supplier
As official and authorized distributors, we supply you with legitimate licenses directly from 200+ software publishers.
See all our Brands.
AlterNET Studio is a development toolkit designed specifically for .NET developers building Windows Forms or WPF applications. It provides a suite of components that integrate seamlessly into your applications, offering functionalities like advanced code editing with features akin to Microsoft Visual Studio, scripting capabilities in various languages for extending application logic, and a visual form designer for crafting user interfaces.
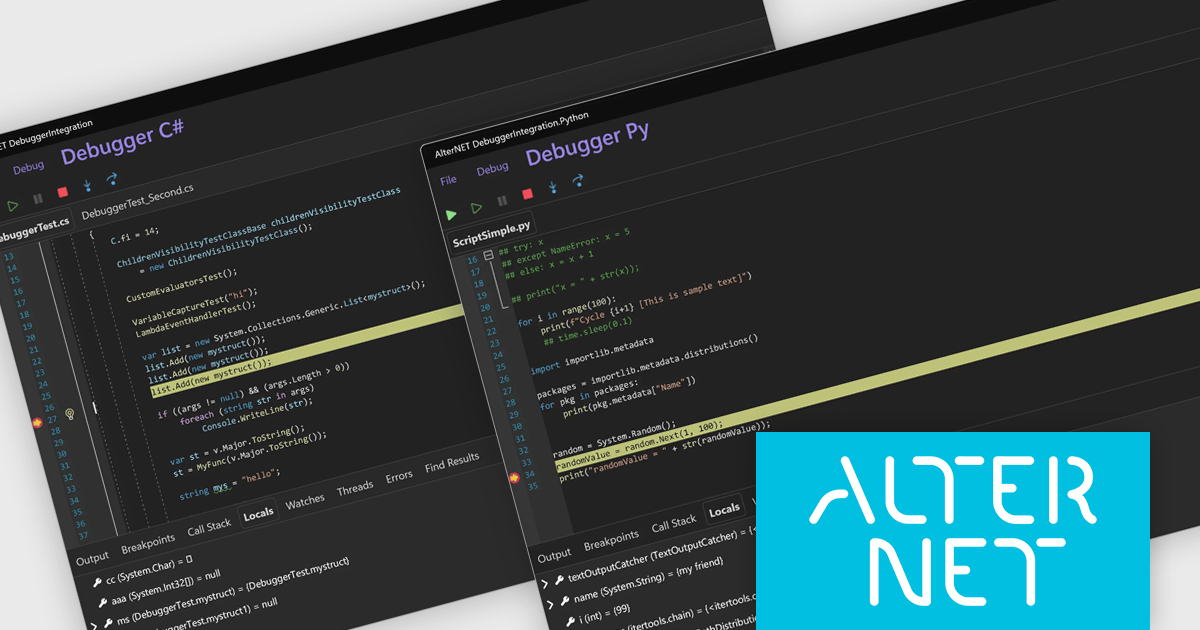
The AlterNET Studio v10 update introduces compatibility for C#, Visual Basic, and Python scripters and debuggers with macOS and Linux, allowing developers to build and debug cross-platform applications without being restricted to a Windows environment. By targeting .NET Standard 2.0, the non-visual components such as scripting engines and parsers are now usable across a broader range of platforms. Additionally, the inclusion of a debugger UI built with AlterNET UI and MAUI enables integration of modern, customizable debugging interfaces into cross-platform applications, improving development and enhancing productivity in multi-OS environments.
To see a full list of what's new in v10, see our release notes.
AlterNET Studio is licensed per developer. A license is only required when developing and compiling applications that use AlterNET Studio; end-users or testers of compiled applications do not require a license. The perpetual license includes a one-year subscription which entitles you to free updates to all new versions during the subscription period. See our AlterNET Studio licensing page for full details.
Learn more on our AlterNET Studio product page.
ComponentOne Studio WPF by MESCIUS is a comprehensive suite of controls designed to enhance the development of WPF applications. It offers a range of powerful and flexible UI components such as data grids, charts, and data visualization tools that integrate seamlessly into WPF projects. This suite enables developers to create modern, responsive, and visually appealing applications with greater efficiency, leveraging robust features and customization options. Its components are optimized for performance and ease of use, allowing for the rapid development of high-quality WPF applications that meet complex business requirements.
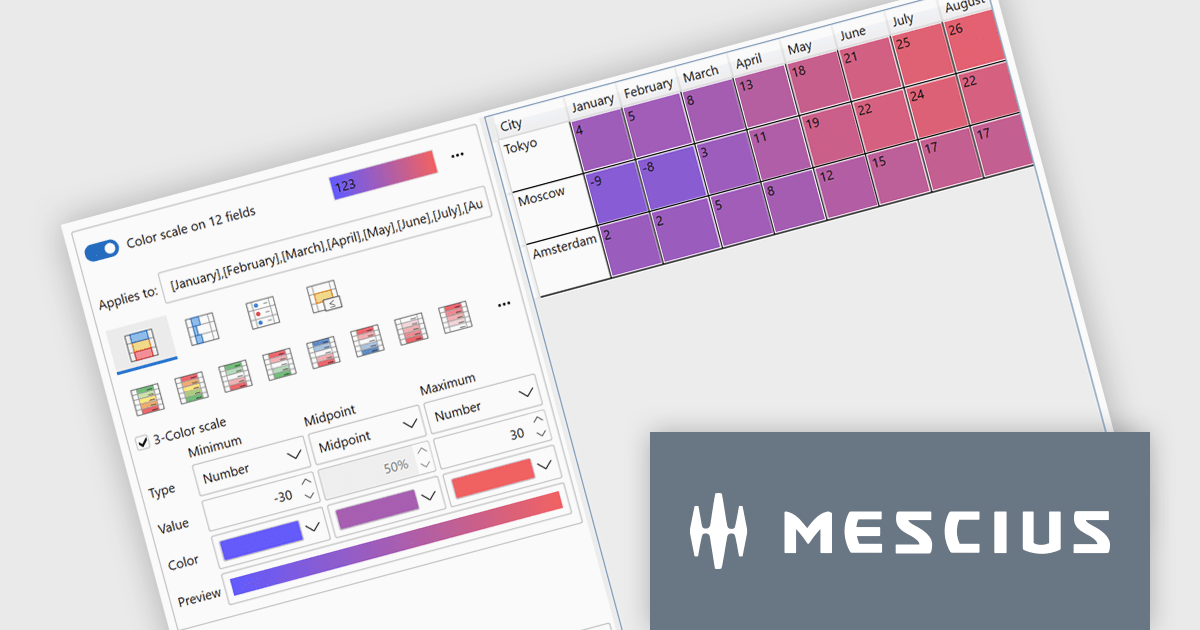
The ComponentOne Studio WPF 2025 v1 update introduces a new Rules Manager UI Library that enables end-users to define, apply, and persist conditional formatting rules directly at runtime. This addition eliminates the need for developers to hardcode rule logic, streamlining customization and reducing maintenance. With support for gradient fills, progress bars, and value-based symbols, the Rules Manager enhances data visualization, making it easier for users to interpret trends and thresholds. Designed to work with FlexGrid, FlexPivot, DataGrid, and ListView controls, it offers a flexible and consistent formatting experience across the application.
To see a full list of what's new in 2025 v1, see our release notes.
ComponentOne Studio WPF is licensed per developer on a perpetual basis and includes a 12 month subscription. See our ComponentOne Studio WPF licensing page for full details.
ComponentOne Studio WPF is available individually or as part of ComponentOne Studio Enterprise.
NOV Chart for .NET by Nevron is a comprehensive .NET charting component suite designed for cross-platform application development. It offers an array of 2D and 3D chart types, along with smart data labeling, an advanced chart axes model, numerous interactivity features and GPU-accelerated real-time rendering based on OpenGL. This library allows developers to seamlessly integrate rich, dynamic and interactive business, scientific, financial and presentation data visualizations into their .NET applications for more effective communication.
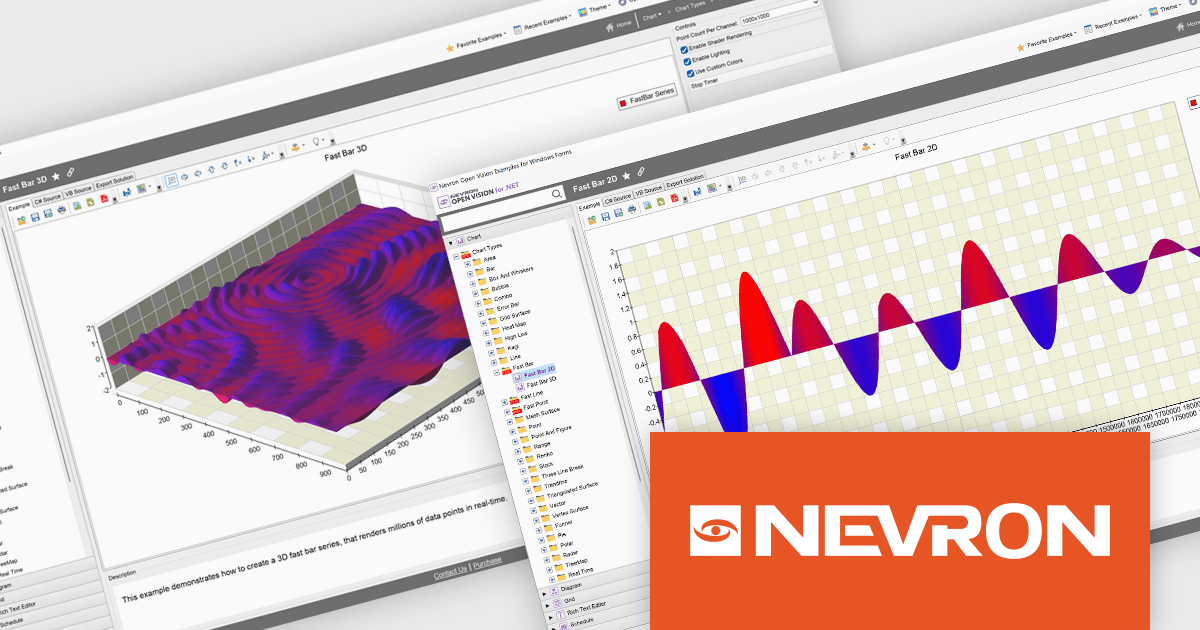
The NOV Chart for .NET 2025.1 update introduces Fast Bar, Fast Line, and Fast Point series that leverage GPU acceleration to deliver real-time visualization of extremely large datasets, enabling developers to render millions of data points with minimal latency in both 2D and 3D contexts and apply per-point color information for detailed analysis. By offloading heavy rendering tasks to the GPU, these new series reduce CPU overhead and free resources for other application logic, making them particularly valuable in scientific, engineering, and medical scenarios where high-throughput data streams must be displayed without delay.
To see a full list of what's new in 2025.1, see our release notes.
NOV Chart for .NET is licensed per developer and is available as a perpetual license with 1 year support and maintenance. See our NOV Chart for .NET licensing page for full details.
NOV Chart for .NET is available in the following products:
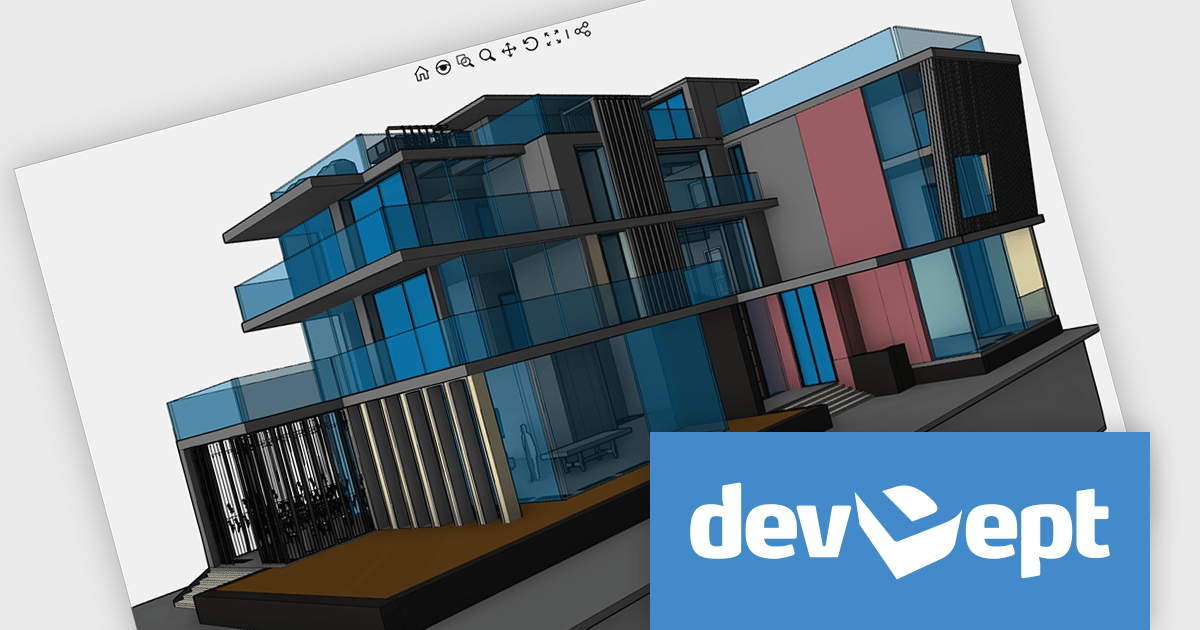
EyeShot by devDept is a comprehensive 3D graphics toolkit designed for .NET developers building engineering and CAD (Computer-Aided Design) applications. It offers a robust set of components for creating, editing, and rendering complex 2D and 3D geometry directly within Windows Forms and WPF environments. With support for advanced modeling features, viewport controls, and industry-standard file formats, EyeShot simplifies the integration of interactive graphics into technical software. It is well-suited for developers working in areas like mechanical design, architecture, and simulation who need high-performance rendering and precise modeling capabilities.
The EyeShot 2025.2 update introduces Shaded VectorView, a major enhancement that replaces the legacy RasterView mode. This new feature enables precise dimensioning directly on shaded views. Shaded VectorView maintains consistent line weights, addressing a long-standing limitation where raster-based views could appear visually inconsistent. By merging the visual fidelity of shaded rendering with the clarity of vector graphics, this upgrade delivers a more unified and production-ready experience for engineers and designers alike.
To see a full list of what's new in version 2025.2, see our release notes.
Eyeshot is licensed per developer and is available as an annual license, with either Lite or Priority support. See our licensing pages for Eyeshot Pro, Eyeshot Ultimate, and Eyeshot Fem for full details.
Eyeshot is available to buy in the following products:
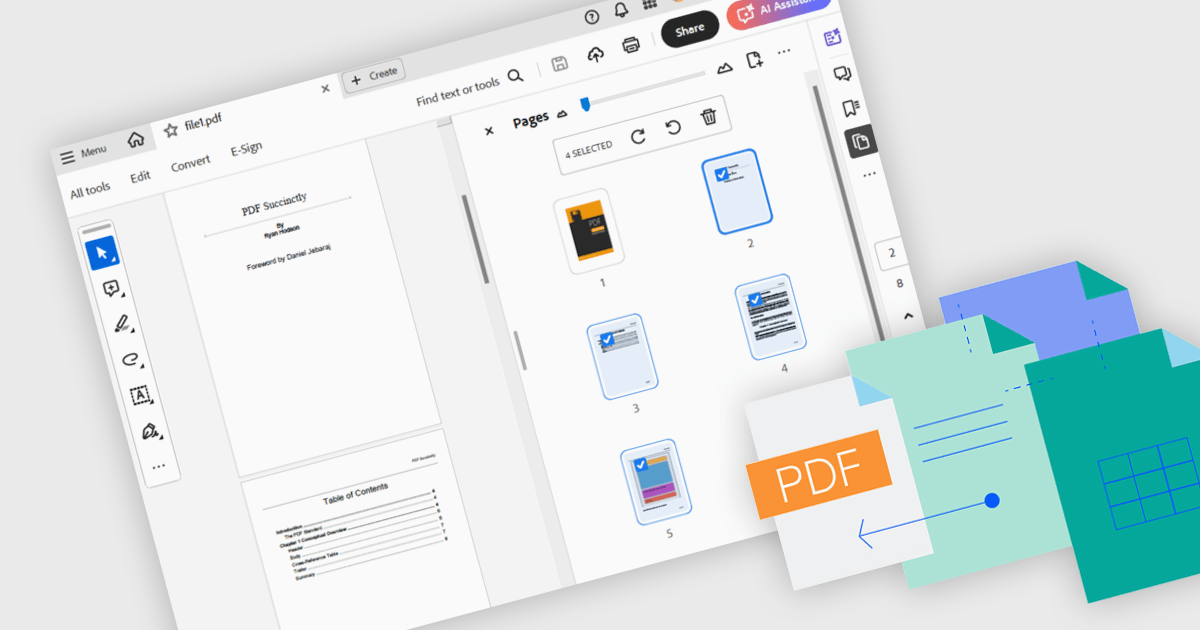
Merging PDFs involves combining two or more separate PDF files into a single cohesive document, preserving the original formatting and quality of each page. This process improves file management by reducing clutter and making it easier to locate and share information, while also minimizing storage overhead. Benefits include consistent headers and footers across pages and simplified collaboration through a single master file for review and annotation. Common use cases include uniting research articles for academic literature reviews, and creating unified project portfolios or client presentations.
Several .NET WPF components offer PDF merging including:
For an in-depth analysis of features and price, visit our comparison of .NET WPF PDF components.


Tel: (888) 850 9911
Fax: +1 770 250 6199


