


Official Supplier
As official and authorized distributors, we supply you with legitimate licenses directly from 200+ software publishers.
See all our Brands.
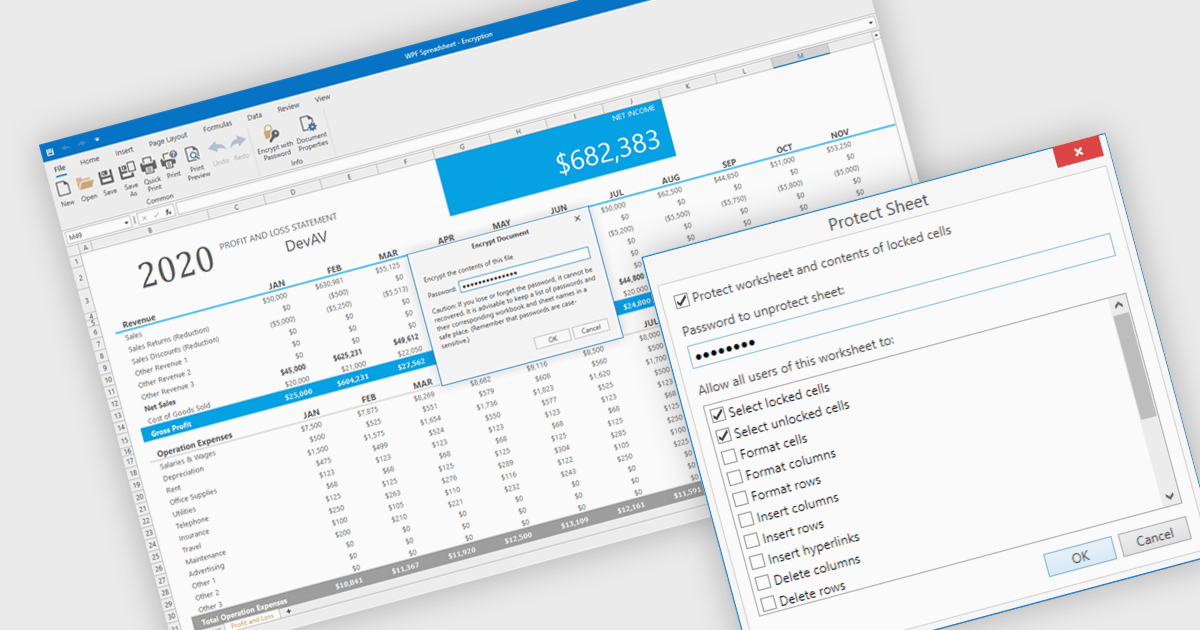
Spreadsheet security features are essential tools designed to protect sensitive data, ensure data integrity, and control user access within spreadsheet applications. These capabilities typically include such measures as password protection or cell locking, and are used to prevent the unauthorized viewing or modification of content in the spreadsheet. Implementing security measures in their spreadsheets allows organizations to maintain compliance with data security standards or data governance policies, and avoid accidental or malicious data loss or alteration. This level of control is particularly important in environments where multiple users collaborate on financial models, project plans, or other critical datasets.
Several WPF spreadsheet components offer security features, including:
For an in-depth analysis of features and price, visit our comparison of WPF spreadsheet components.
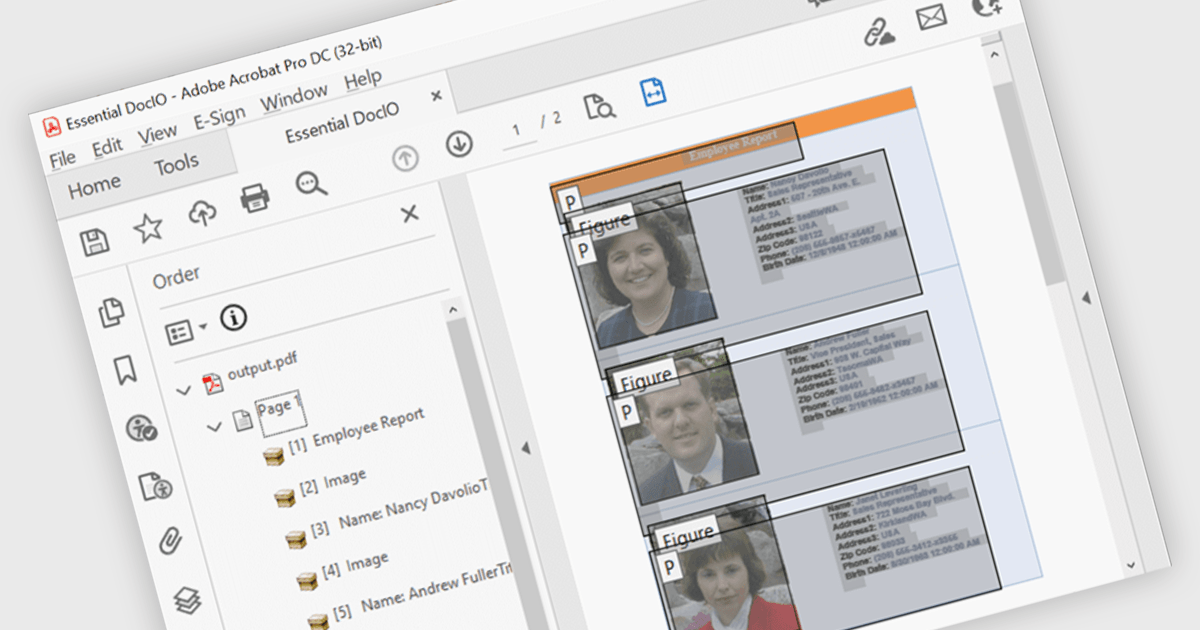
Accessibility support in PDF components enables developers to produce documents that are easier to navigate for users who rely on assistive technologies. These enhancements include automated tagging for headings, lists, and tables, improved support for screen readers, and logical reading order preservation. By integrating features that align with standards like WCAG and PDF/UA, modern PDF libraries help ensure that documents are not only visually accurate but also semantically rich. This allows developers to meet accessibility requirements with greater ease, particularly in sectors where compliance and usability are essential.
Several .NET WPF PDF components feature accessibility support, including:
For an in-depth analysis of features and price, visit our comparison of .NET WPF PDF components.
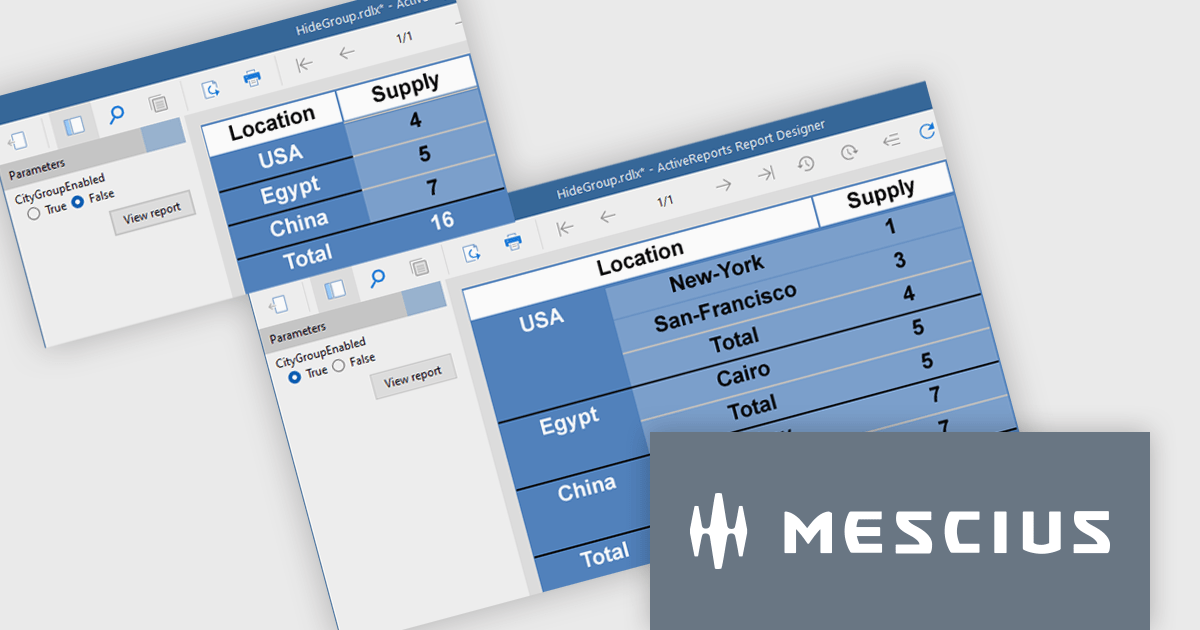
ActiveReports.NET from MESCIUS, is a comprehensive reporting solution for developers building applications in .NET. It empowers you to design and deliver visually appealing reports through user-friendly designers and a wide range of controls. ActiveReports simplifies report creation and distribution with a versatile API, rich data source connectivity, and support for multiple export formats. This translates to increased developer productivity and improved end-user experience with powerful reporting functionalities within your .NET applications.
The ActiveReports v19.1 update introduces enhanced grouping control that allows developers to enable or hide groups in Tables, BandedLists, and Tablix controls based on expressions or parameters. This capability makes it easier to design reports that adapt at runtime to different data scenarios or user inputs, without requiring code changes. By configuring the new "Enabled" and "Hidden" properties directly within the report definition, developers can deliver more flexible and maintainable reporting solutions that respond dynamically to business logic.
To see a full list of what's new in v19.1, see our release notes.
ActiveReports.NET is licensed per developer and is available with or without a 12 month support and maintenance subscription. See our ActiveReports.NET licensing page for full details.
Learn more on our ActiveReports.NET product page.
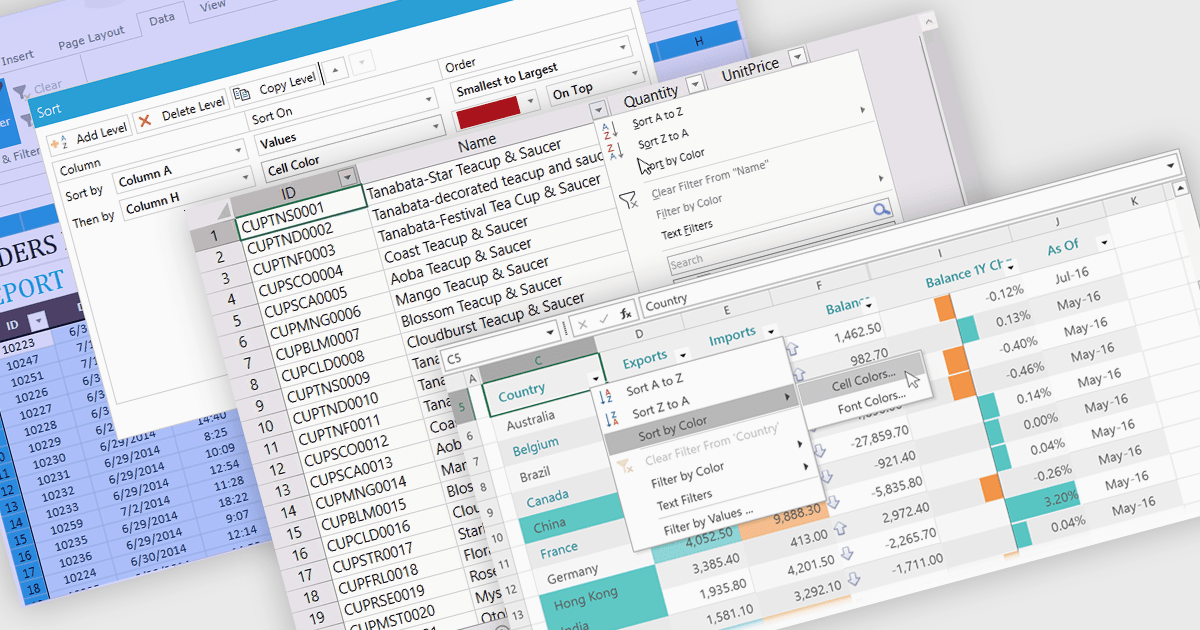
Data sorting in a spreadsheet control is a fundamental feature that enables users to rearrange data within a grid or table based on specific criteria, typically ascending or descending alphabetically or by numerical value. Sorting will usually be performed on single or multiple columns and is often integrated with other data manipulation tools like filtering, grouping, and searching. By sorting data, users can quickly locate and analyze information, identify patterns, and ensure consistency across records. Especially useful in large datasets, it improves the readability of the information and makes it more organized in preparation for decision-making, reporting, and data validation. This capability facilitates efficient data analysis, and supports better user interaction by allowing datasets to be viewed in meaningful sequences.
Several WPF spreadsheet controls offer support for data sorting including:
For an in-depth analysis of features and price, visit our WPF spreadsheet controls comparison.
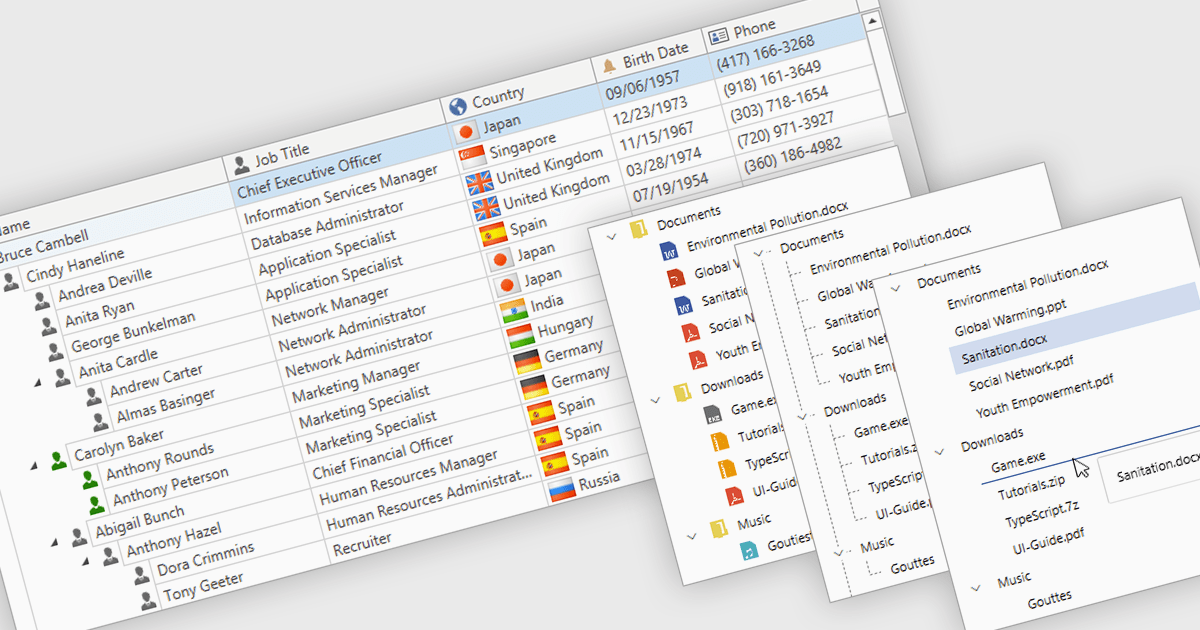
Tree lists, commonly included in professional UI component suites, are advanced controls designed to display hierarchical data in a structured and expandable format. They present parent-child relationships clearly, allowing users to navigate through multiple levels of data with ease. With features such as collapsible nodes, dynamic data loading, and customizable templates, tree lists improve both performance and user experience, particularly when working with large or complex datasets. In user interface development, they are frequently used for file explorers, category navigation, permission settings, project management views, and organizational charts. By integrating tree lists, developers can provide a more intuitive, scalable, and interactive way to manage structured information.
Several WPF UI suites offer tree list components including:
For an in-depth analysis of features and price, visit our WPF UI suites comparison.


Tel: (888) 850 9911
Fax: +1 770 250 6199


