


Official Supplier
As official and authorized distributors, we supply you with legitimate licenses directly from 200+ software publishers.
See all our Brands.
Telerik UI for Blazor is a comprehensive UI library that provides over 110 native and customizable Blazor components for building modern and feature-rich web applications. This professional-grade solution offers a complete set of components to satisfy all user interface requirements, saving time and effort in UI design.
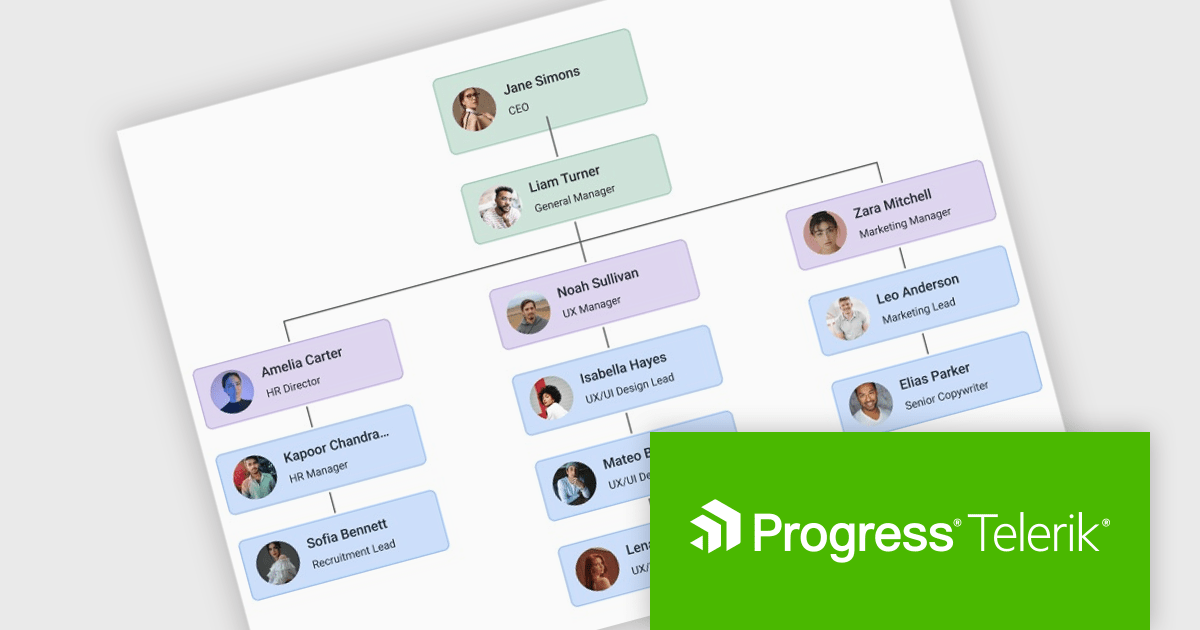
The Telerik UI for Blazor 2025 Q3 update introduces a new Diagram component that enables developers to effectively model, display, and manage complex data, structures, and processes within their applications. With support for built-in layouts, customizable shapes, and flexible connections, the Diagram improves the creation of organizational charts, process flows, and other visual representations without requiring extensive manual coding. Workflow-ready elements and user interaction capabilities ensure that diagrams are not static images but functional components that respond to events and actions, making them a practical tool for building interactive and data-driven Blazor applications.
To see a full list of what's new in 2025 Q3 (v11.1.1), see our release notes.
Telerik UI for Blazor is licensed per developer and has two licensing models: an annual Subscription License and a Perpetual License. The Subscription license provides access to the latest product updates, technical support, and exclusive benefits for a flat annual fee, and must be renewed to continue using the software. The Perpetual license is a one-time purchase granting access to the current released version and includes a one-year subscription for product updates and technical support. After this initial period, users can choose to renew the subscription element to continue receiving updates and support; otherwise, they may continue using the installed version available during their active subscription term but will forgo future updates and support. See our Telerik UI for Blazor licensing page for full details.
Telerik UI for Blazor is available individually or as part of the following products:
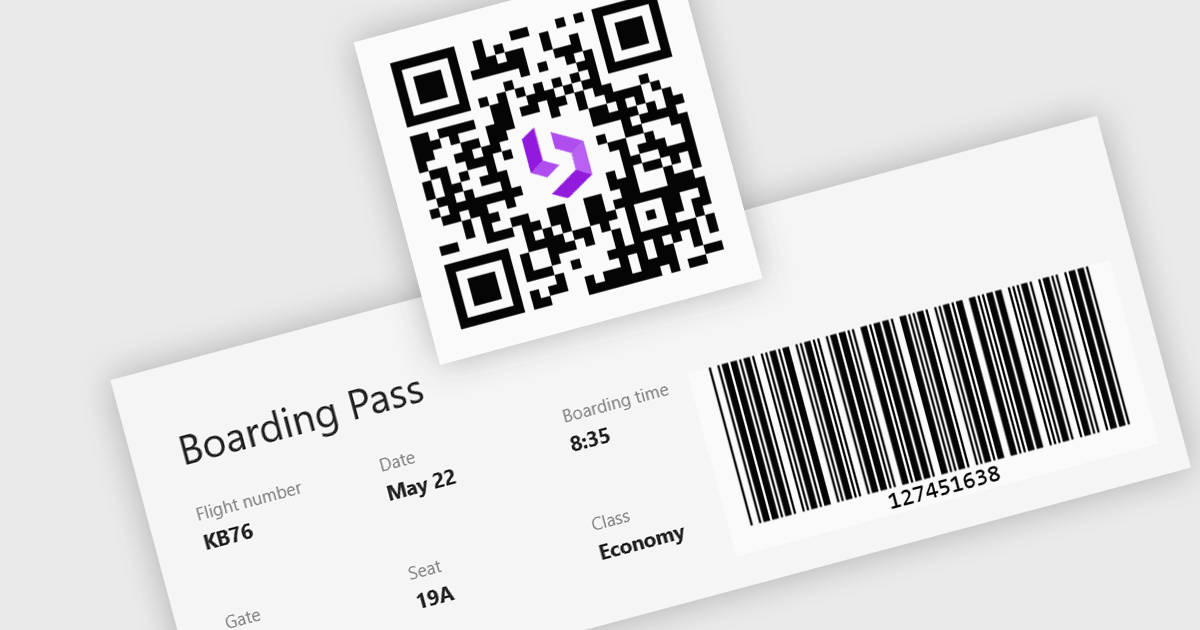
Barcode support in a Blazor UI suite refers to built-in components or controls that enable developers to generate and display barcodes directly within applications. This functionality simplifies the integration of barcode-based processes in retail, logistics, healthcare, and inventory management systems by allowing data encoding and visualization without relying on third-party tools. For software developers, the key benefit is faster implementation of barcode features with consistent styling and customization options, helping maintain application cohesion while supporting machine-readable data formats.
Several Blazor UI suites provide barcode functionality, including:
For an in-depth analysis of features and price, visit our comparison of Blazor UI suites.
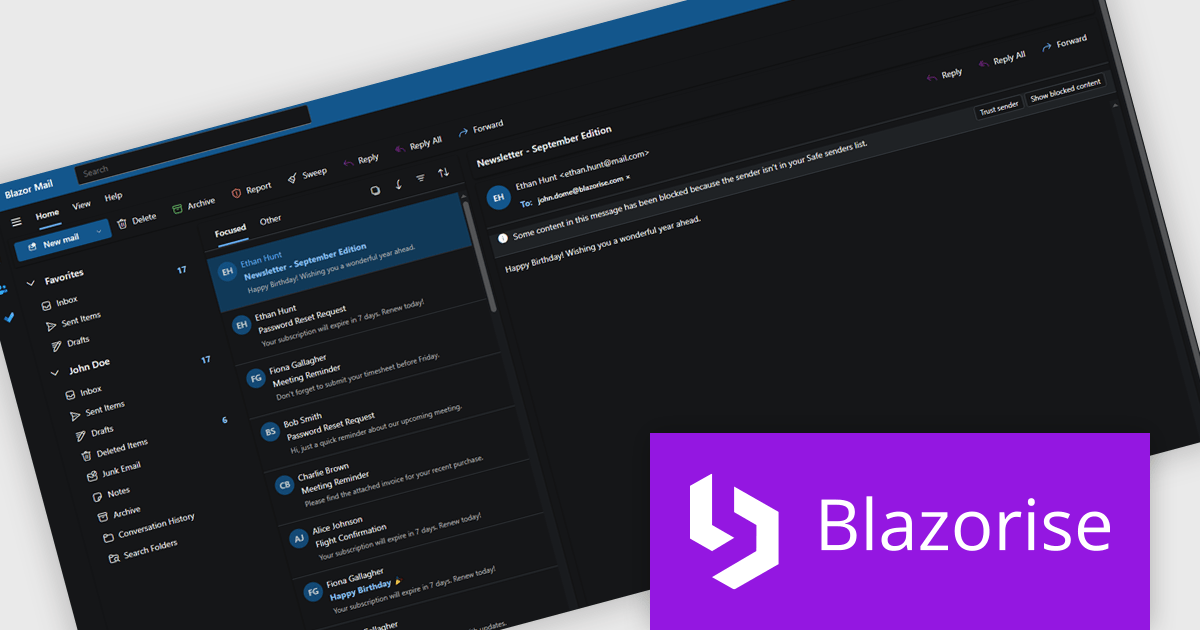
Blazorise is a versatile component library that empowers developers to build modern and feature-rich web applications using Blazor, a client-side web development framework from Microsoft. It offers a comprehensive collection of user interface components, including buttons, forms, charts, and navigation elements, all built with accessibility and responsiveness in mind.
The Blazorise 1.8.2 update introduces a Fluent UI Dark Theme that enables developers to deliver a consistent and accessible dark mode experience across their applications. It provides a complete set of tuned color tokens covering surfaces, typography, and accents, ensuring all Fluent UI components such as DataGrid, Modal, Sidebar, Dropdown, Button, and Tabs maintain visual coherence without additional customization. The theme also integrates with existing light and dark mode toggling, automatically adapting to the application’s current color scheme.
To see a full list of what’s new in version 1.8.2, see our release notes.
Blazorise is licensed per developer and includes a 1 year subscription for updates and support. Professional, Enterprise, and Enterprise Plus editions are available, each offering tailored levels of support and service to meet varying business needs. See our Blazorise licensing page for full details.
For more information, visit our Blazorise product page.
DevExpress DXperience is a comprehensive development suite that enables developers to build high-performance applications for Windows, Web, mobile, and tablet platforms using a unified set of controls and tools. It includes hundreds of desktop UI controls for WinForms, WPF, and reporting, as well as web UI controls for Blazor, ASP.NET, MVC, Core, Bootstrap Web Forms, JavaScript, Angular, React, Vue, and web reporting, plus productivity tools like XPO ORM and CodeRush for Visual Studio. With its extensive component library, DXperience accelerates development, ensures visually consistent and responsive interfaces, and is ideal for creating enterprise applications, data-driven web apps, dashboards, and reporting solutions.
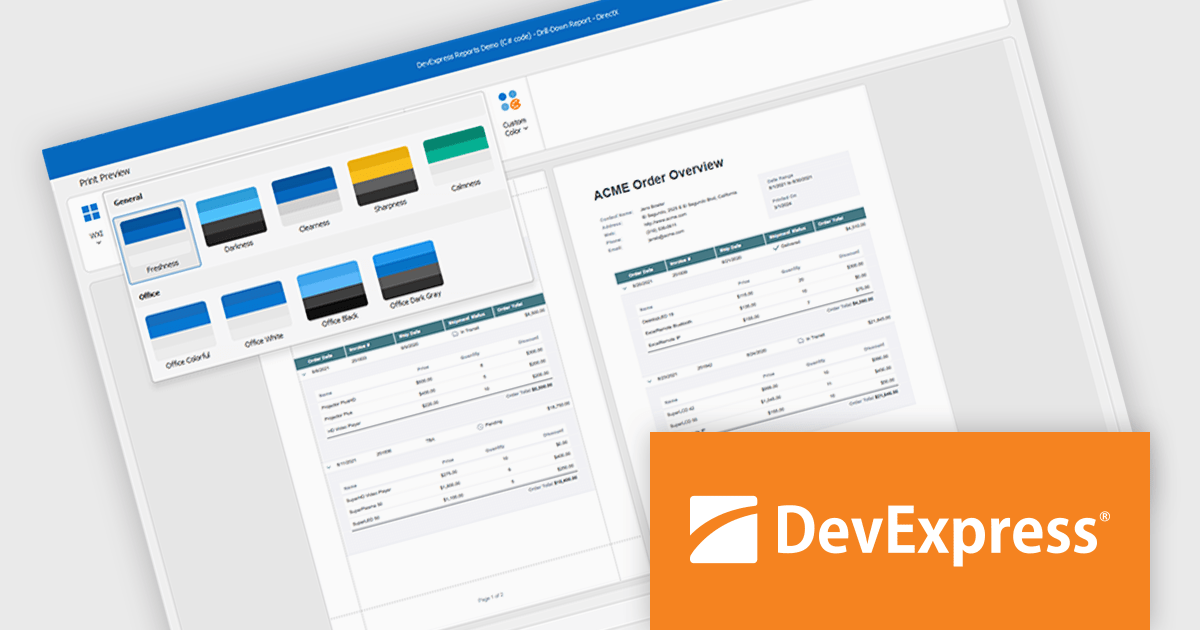
DevExpress DXperience enhances application development with new app-wide themes and skins, allowing developers to apply a consistent, modern visual style across entire projects with minimal configuration. By providing professionally designed themes that align with Microsoft Office and Windows 11 aesthetics, along with built-in tools for customizing these designs, it improves the UI design process and reduces the need for manual styling. This enables developers to focus on functionality while delivering polished, cohesive user interfaces that improve usability and maintain a professional appearance across all application modules.
DevExpress DXperience is licensed per developer and is available as a Perpetual License with a 12 month support and maintenance subscription. See our DevExpress DXperience licensing page for full details.
For more information, visit our DevExpress DXperience product page.
Drill down support in reporting components enables developers to design interactive reports that progressively reveal more detailed data as users click on summary items. This feature allows users to explore underlying datasets directly within the report interface, eliminating the need to switch between views or load separate reports. By structuring data hierarchically, developers can provide a more intuitive and efficient navigation experience for end-users. It is especially valuable in dashboards or business intelligence tools where data granularity is critical for analysis and decision-making.
Several .NET Blazor Reporting controls support drill down features including:
For an in-depth analysis of features and price, visit our comparison of .NET Blazor Reporting Controls.


Tel: (888) 850 9911
Fax: +1 770 250 6199


