


Official Supplier
As official and authorized distributors, we supply you with legitimate licenses directly from 200+ software publishers.
See all our Brands.
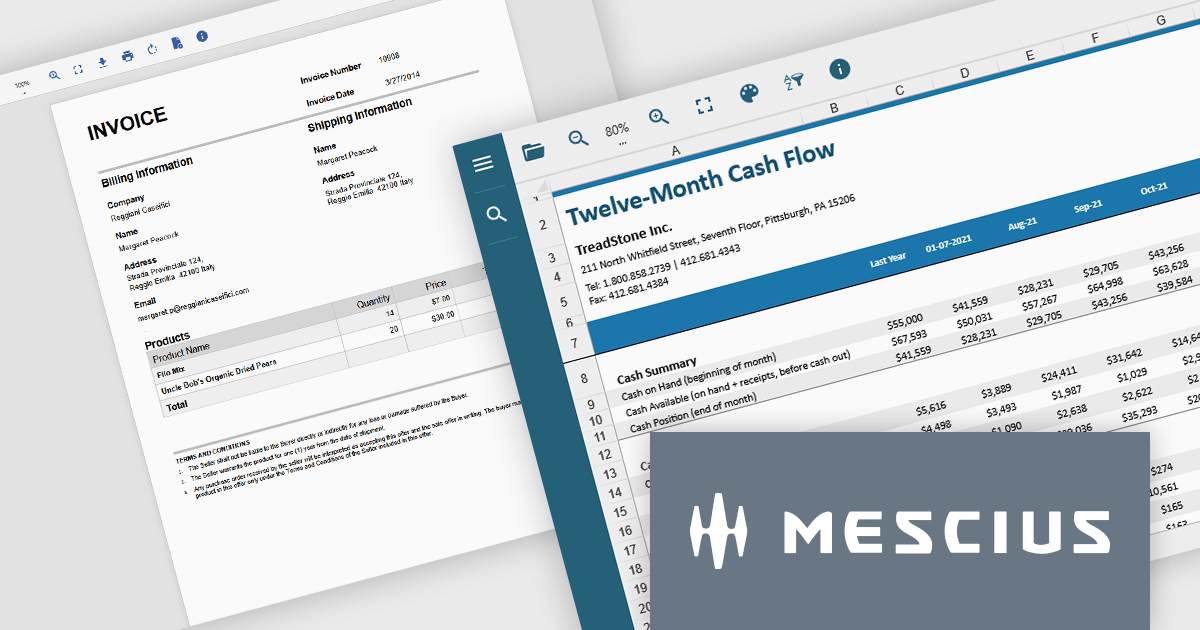
Document Solutions .NET Bundle by MESCIUS is a complete suite of APIs and viewing tools that enhance document processing and improve efficiency. It includes Documents for Excel, Word, PDF, and Imaging, plus standard licenses for the PDF Viewer, Data Viewer, and Image Viewer. Combining powerful .NET APIs with responsive JavaScript-based viewers, it enables creating, editing, converting, and displaying multiple document formats within applications. This unified solution delivers fast, reliable, and secure document handling, making it ideal for enterprise document management, automated reporting, digital archiving, and collaborative review across devices and platforms.
The Document Solutions .NET Bundle offers a versatile range of tools to handle every stage of the document lifecycle, from creation and editing to viewing and distribution. With dedicated APIs for Excel, Word, PDF, and imaging, developers can implement advanced capabilities such as data manipulation, text extraction, format conversion, image processing, and PDF generation directly within their applications. The included PDF Viewer, Data Viewer, and Image Viewer provide rich, interactive experiences for end users, enabling smooth navigation, zooming, searching, and annotation.
MESCIUS has created a detailed feature breakdown to highlight Document Solutions performance and total cost of ownership compared with other solutions. You can view the Document Solutions Product Comparison now.
By integrating both powerful back-end processing and intuitive front-end viewing, the bundle reduces the need for multiple third-party components, simplifies development, and delivers consistent, high-quality document interactions across platforms.
Document Solutions .NET Bundle is licensed per developer and is available in several license options for differing distribution needs. Team licenses are also available for multiple developers within the same organization. See our Document Solutions .NET Bundle licensing page for full details.
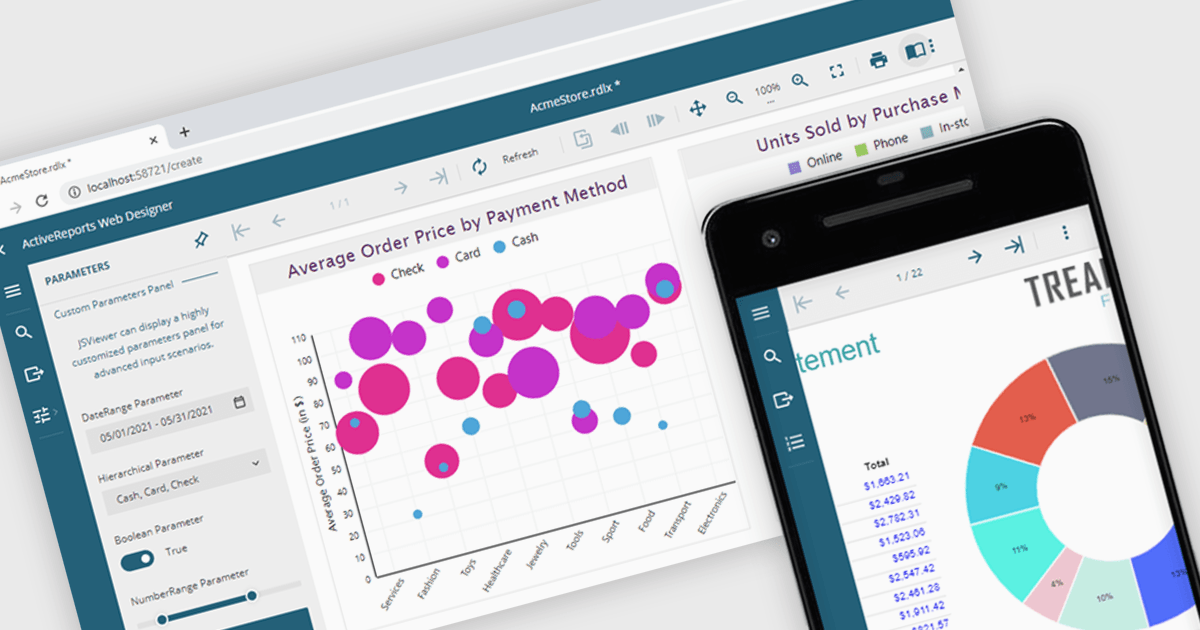
A JavaScript report viewer in a .NET reporting component is a client-side web interface that allows users to view, navigate, and interact with reports generated by a .NET-based reporting engine. It enables embedding of reports into web applications built with JavaScript frameworks such as Angular, React, or Vue, while relying on the .NET backend to handle report generation and data processing. This setup allows developers to deliver responsive, interactive report viewing experiences within modern browser environments, without requiring full-page reloads or complex server-side rendering.
Several .NET reporting controls feature a JavaScript report viewer including:
For an in-depth analysis of features and price, visit our comparison of .NET reporting controls.
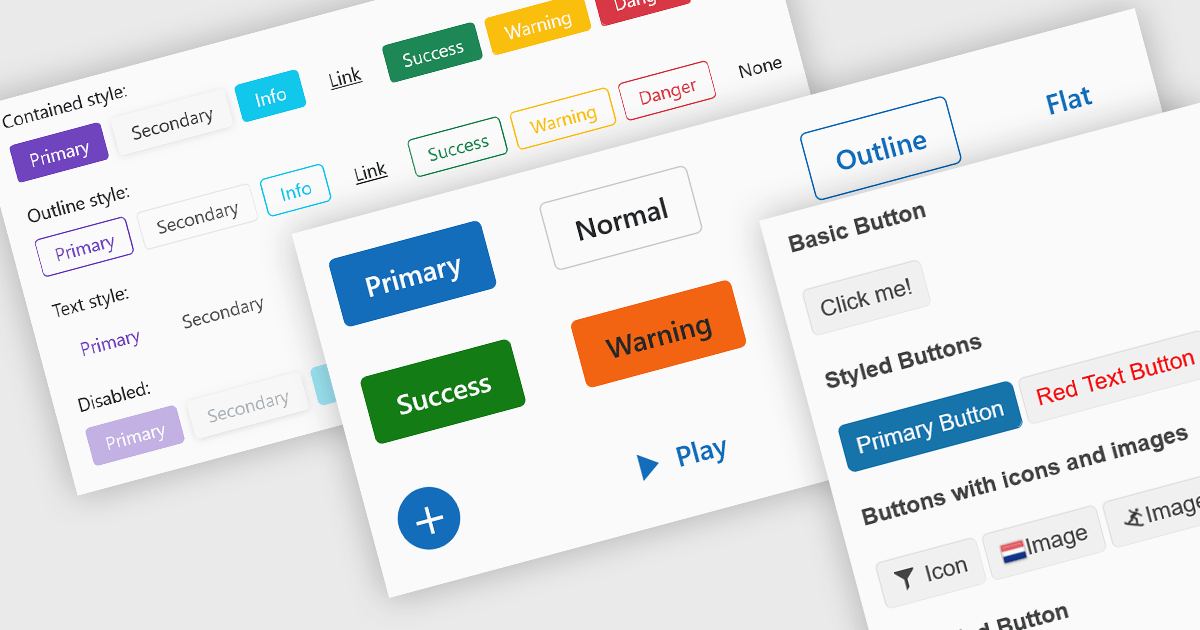
Buttons embedded in data editors enhance user interactions by providing inline command triggers such as clearing input, opening dropdowns, or submitting data. These buttons can be integrated directly into form fields or data grids, enabling more intuitive and compact interfaces. Developers benefit from customization options like icons, styles, behaviors, and events, allowing button functionality to be tailored to application-specific workflows. The inclusion of command buttons in editors simplifies interactions without the need for external UI elements.
Several Blazor data editor collections offer button editor components including:
For an in-depth analysis of features and price, visit our Blazor data editors comparison.
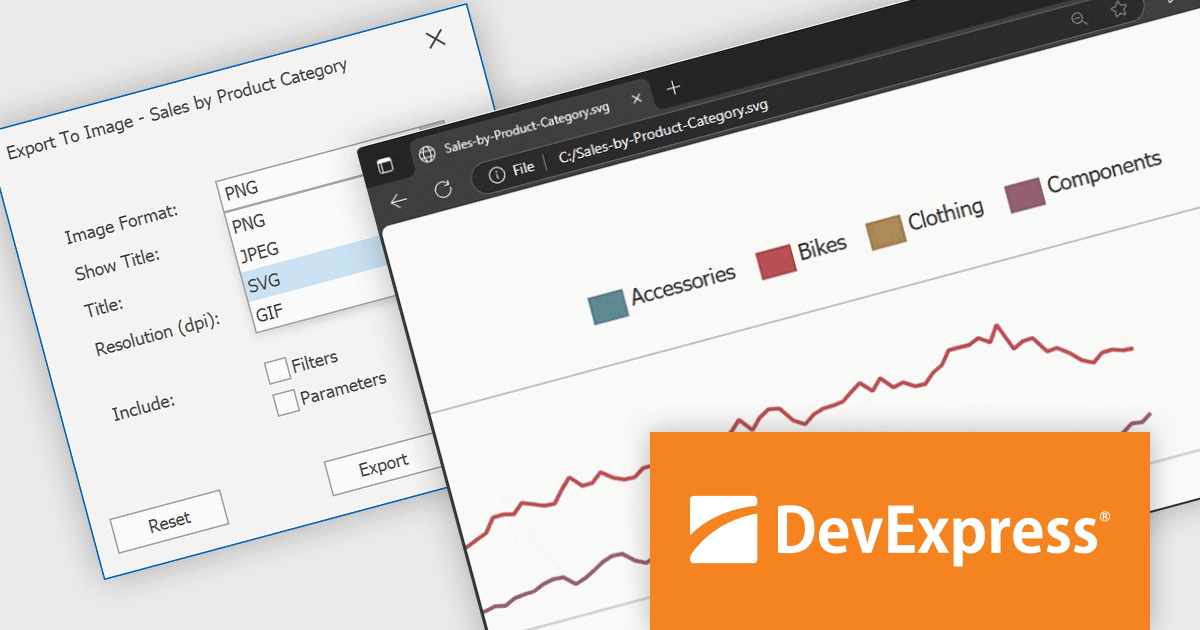
DevExpress BI Dashboard (part of DevExpress Universal) empowers you to craft interactive dashboards for desktop, web and mobile applications. It provides a visual designer for building dashboards without writing code, allowing you to drag-and-drop various data visualization widgets onto the canvas. These widgets connect to your data sources and update dynamically, offering real-time insights to end users. The tool also supports customization through properties and events, enabling you to tailor the look and feel of the dashboards to perfectly integrate with your application's design.
The DevExpress BI Dashboard v25.1 update adds support for exporting entire dashboards, specific items, or tab pages to Scalable Vector Graphics (SVG) format. This enhancement allows users and analysts to create resolution-independent, high-quality exports that maintain clarity at any size. SVG output is particularly useful for printed reports, shared presentations, or integration into documentation, where visual fidelity is essential.
To see a full list of what's new in version 25.1, see our release notes.
DevExpress BI Dashboard is included as part of DevExpress Universal which is licensed per developer and is available as a Perpetual License with a 12 month support and maintenance subscription. See our DevExpress Universal licensing page for full details.
DevExpress BI Dashboard is available in the following products:
DevExpress Blazor (part of DevExpress ASP.NET and Blazor) helps you create high-impact user experiences for both Blazor Server and Blazor WebAssembly using C#. The Blazor UI Component Library ships with a comprehensive set of native components (including a DataGrid, Pivot Grid, Scheduler, Chart, Data Editors and Reporting).
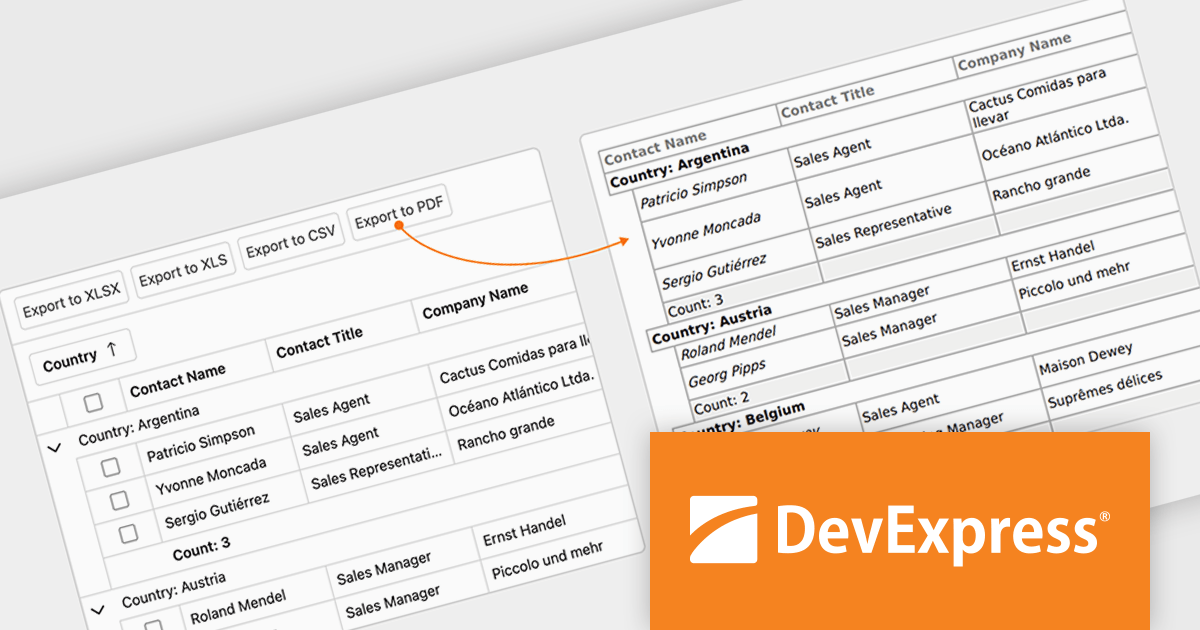
The DevExpress Blazor v25.1 update enhances the Blazor Grid component with support for PDF export, allowing developers to generate documents that mirror the current data view. This includes all applied filters, sort orders, and group configurations, ensuring that the exported content matches the user's on-screen context. The PDF output retains data columns, group rows with summaries, and overall total summaries, making it a practical tool for sharing, archiving, or printing user-customized reports. This update helps developers deliver consistent, visually structured documents from within Blazor applications.
To see a full list of what's new in version 25.1, see our release notes.
DevExpress ASP.NET and Blazor is licensed per developer and is available as a Perpetual License with a 12 month support and maintenance subscription. See our DevExpress ASP.NET and Blazor licensing page for full details.
DevExpress Blazor is available in the following products:


Tel: (888) 850 9911
Fax: +1 770 250 6199


