








Official Supplier
As official and authorized distributors, we supply you with legitimate licenses directly from 200+ software publishers.
See all our Brands.
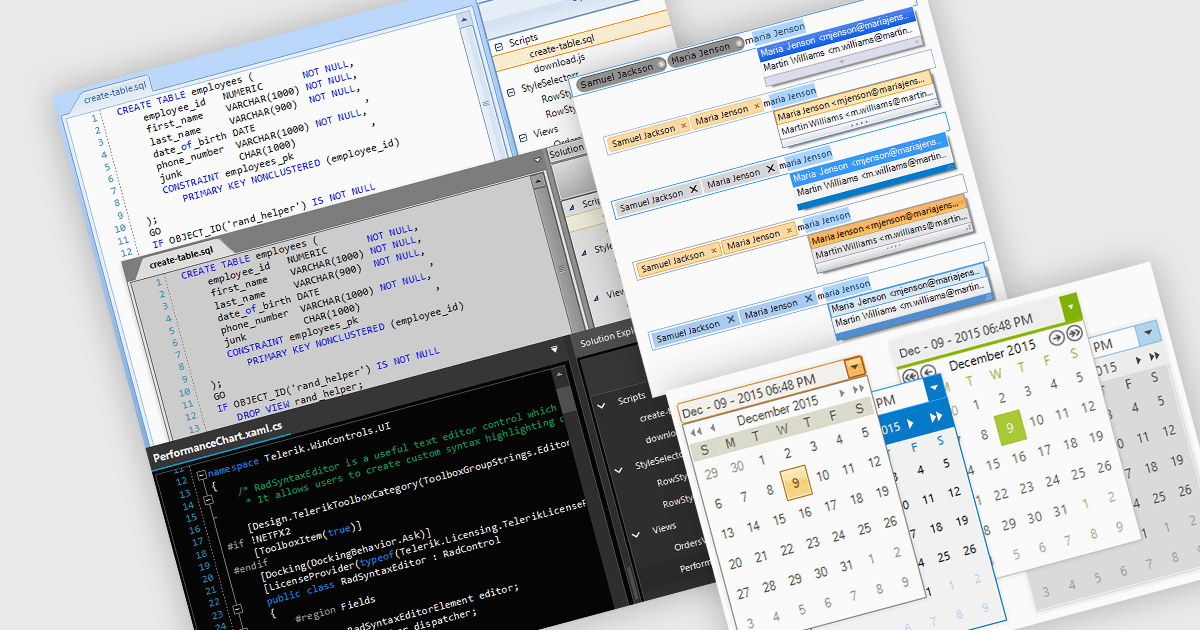
Data editors are user interface components designed to facilitate the viewing, input, modification, and management of data within applications. The visual appearance and styling of these components can often be customized to improve readability, user focus, and comfort during data manipulation and analysis tasks. This can include adjusting factors colors, fonts, layouts, and overall design aesthetics. Theming not only enhances the visual appeal of the data editor but also improves its usability and accessibility for users, whilst also creating a more cohesive and personalized experience which can be aligned with the organization's branding.
Several .NET 8 WinForms data editor collections allow you to apply themes, including:
For an in-depth analysis of features and price, visit our comparison of .NET 8 WinForms data editor collections.
Spread.NET by MESCIUS is a powerful tool for building Excel-like applications in your .NET projects. It lets you create interactive spreadsheets, grids, dashboards, and even forms within WinForms, ASP.NET, and WPF applications. With its rich feature set, including a robust calculation engine, formula support, and Excel compatibility, Spread.NET empowers developers to build data analysis tools, budgeting apps, scientific dashboards, and more, all within the familiar .NET environment.
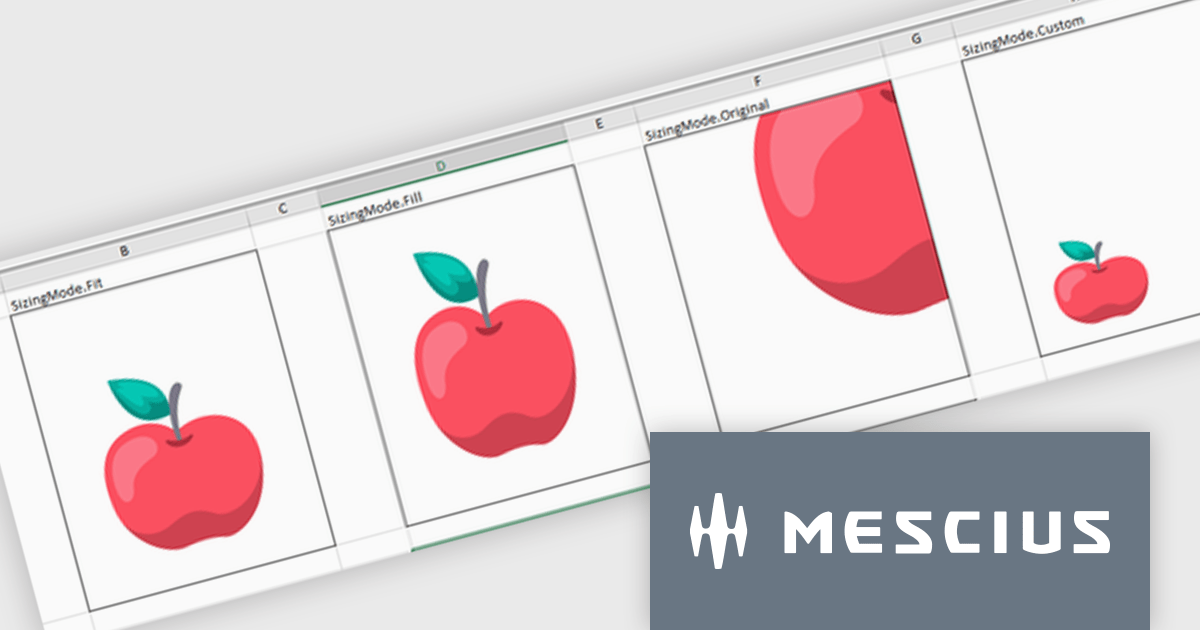
The Spread.NET v17.2 release introduces greater cell image versatility and customization. With four new distinct sizing options—Fit, Fill, Original, and Custom—users gain precise control over how images are displayed within cells. The Fit mode maintains the image's aspect ratio while ensuring it fits within the cell, preventing distortion. The Fill option covers the entire cell, disregarding the aspect ratio for full coverage. Original preserves the image's natural size, even if it exceeds the cell's dimensions, while Custom allows users to set specific height and width parameters. These flexible sizing options enhance the presentation of images, offering tailored solutions to fit various content needs, whether it’s for data visualization, design, or reporting purposes. This feature significantly improves visual control, ensuring consistency and a professional appearance across documents.
To see a full list of what's new in v17.2, see our release notes.
Spread.NET is licensed per developer and is available as a Perpetual License with a 12 month support and maintenance subscription. We can supply any Spread.NET license including new licenses, maintenance renewals, and upgrade licenses. See our Spread.NET licensing page for full details.
For more information, visit our Spread.NET product page.

Infragistics Ultimate UI for Windows Forms is a comprehensive suite of over 100 pre-built UI controls and components designed to accelerate Windows Forms application development. It offers a rich feature set including grids, charts, dashboards, reports, and Microsoft Office-style UI elements, enabling developers to create visually appealing, high-performing, and touch-enabled applications with minimal coding effort.
The Infragistics Ultimate UI for Windows Forms 24.1 release introduces a powerful new feature for the UltraDataChart: Data Legend and Data Tooltip Grouping. This innovative enhancement allows users to effectively categorize and organize large datasets by grouping related series together. When multiple series share the same group text, they are visually clustered together within both the data legend and tooltips, providing a clear and intuitive representation of the data. This feature significantly improves data comprehension and analysis, making it easier for users to extract meaningful insights from complex datasets.
To see a full list of what's new in 24.1, see our release notes for Infragistics Ultimate UI for Windows Forms.
Infragistics Ultimate UI for Windows Forms is licensed per developer and is available as a perpetual license with 1, 2 or 3 year support and maintenance subscription. See our Infragistics Ultimate UI for Windows Forms licensing page for full details.
Infragistics Ultimate UI for Windows Forms is available to buy in the following products:
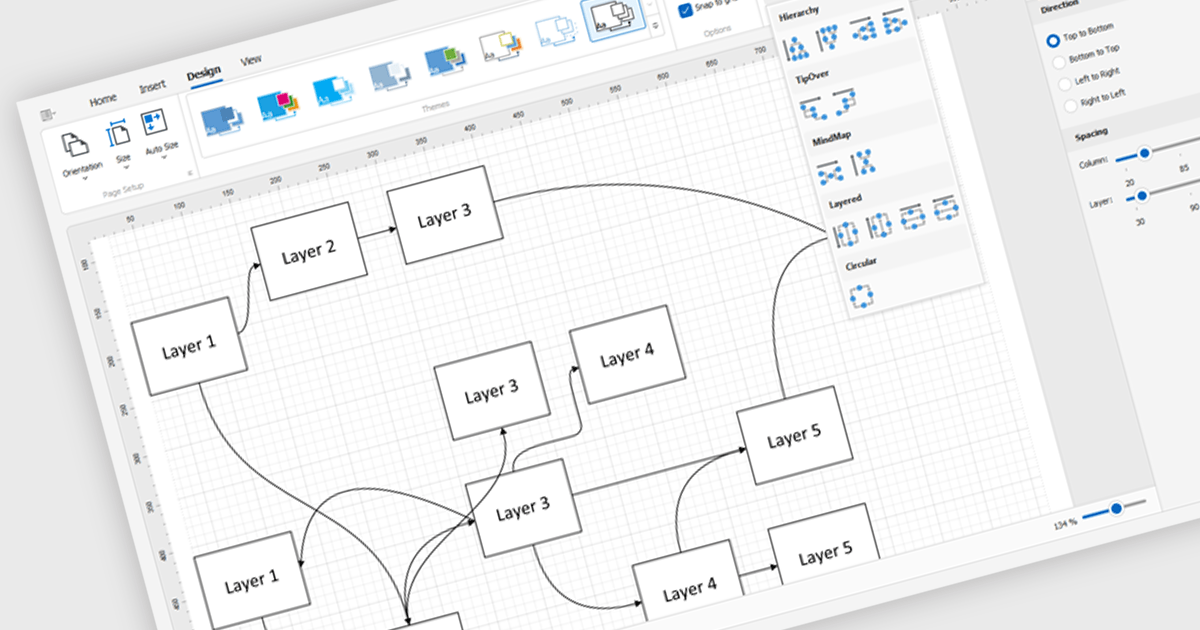
Diagram controls provide pre-built graphical elements for constructing various diagrams, flowcharts, and organizational charts within applications. These components accelerate development by offering customizable shapes, connectors, layouts, and interaction features, enabling developers to rapidly create visually appealing and interactive diagrams without extensive manual coding, thereby enhancing user experience and application functionality.
Many .NET WinForms UI Suite collections contain diagram controls including:
For an in-depth analysis of features and price, visit our comparison of .NET WinForms UI Suites.
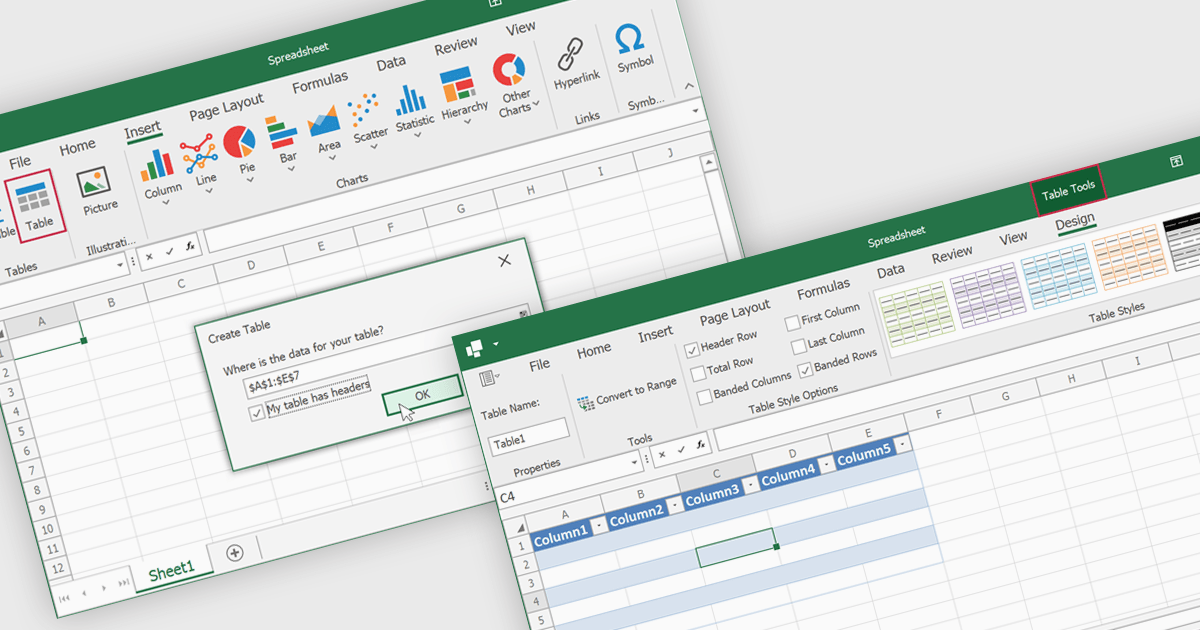
Spreadsheet tables are organized groups of data in a spreadsheet, often with a header row and a range of cells containing related information. They make data management easier by grouping related information, improving how it looks and how easy it is to use. You can use functions and formulas on entire tables to automate calculations and reduce manual work. Tables often let you filter and sort data based on specific criteria, making analysis and reporting easier. Common uses include financial analysis, inventory management, project tracking, and customer databases.
Several WinForms spreadsheet controls offer table support including:
For an in-depth analysis of features and price, visit our WinForms spreadsheet controls comparison.





Tel: (888) 850 9911
Fax: +1 770 250 6199


