


Official Supplier
As official and authorized distributors, we supply you with legitimate licenses directly from 200+ software publishers.
See all our Brands.
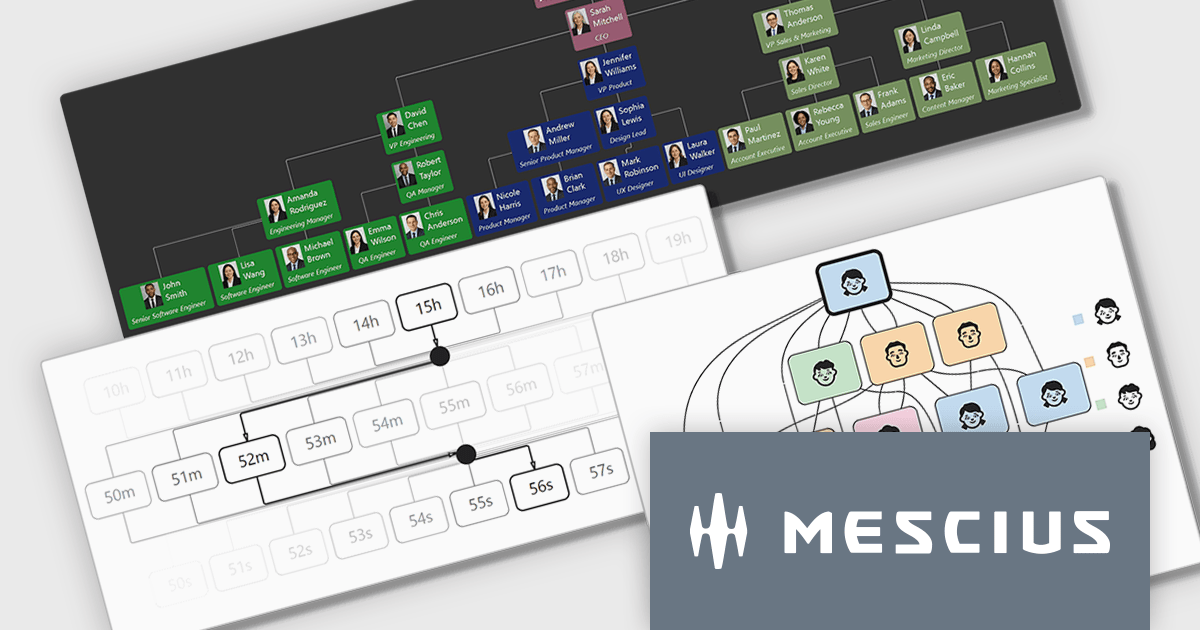
ComponentOne WinForms Edition is a collection of easy-to-use WinForms components that provides access to all updates released within your 1 year subscription period and online support. ComponentOne Winforms Edition includes FlexGrid, FlexChart, FlexReport, InputPanel, Ribbon, DockingTab, and more.
On Wednesday, April 8th at 11:00 AM EDT, MESCIUS is presenting a CodeClinic Live Webinar effecting a deep dive into how .NET developers can convert hierarchical and rule-based datasets into interactive visual diagrams in a Windows Forms application using ComponentOne FlexDiagram. MESCIUS Product Manager Greg Lutz will show you how to bind structured application data to diagram elements, define node relationships, and dynamically generate diagrams using C#. Key takeaways include:
Register for the Live Webinar today and mark your calendar for April 8th.
ComponentOne Studio WinForms is licensed per developer and is available as either a Perpetual or Annual license, depending upon geographic location. Priority Support is also available. See our ComponentOne Studio WinForms licensing page for full details.
Learn more on our ComponentOne Studio WinForms product page.
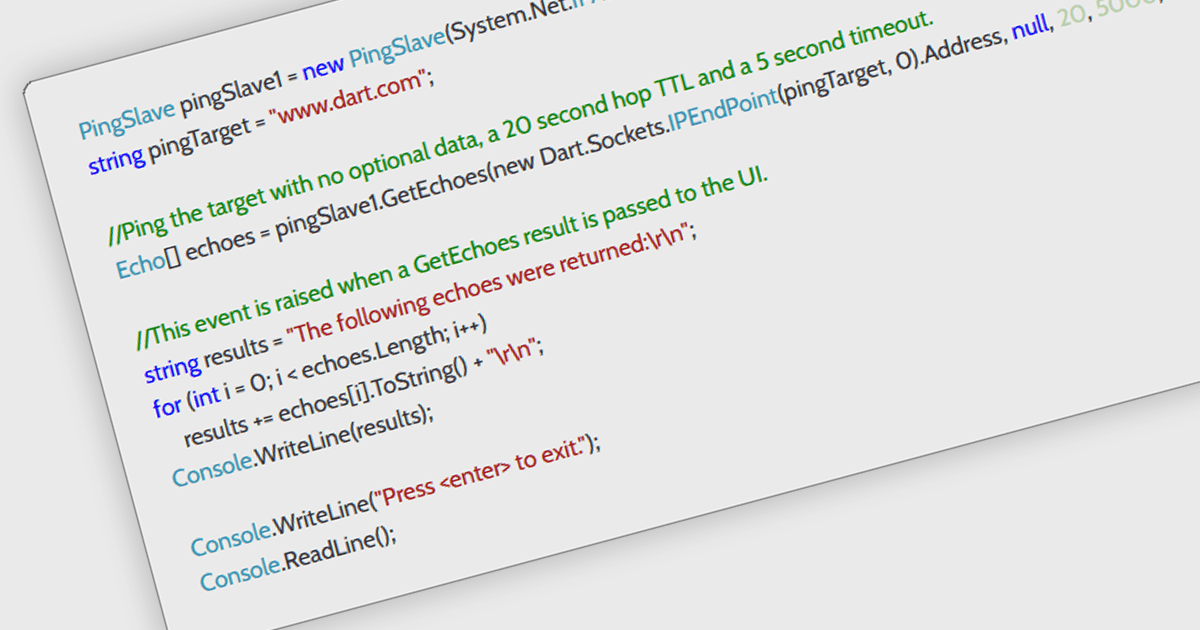
ICMP support in a .NET communication and messaging control means the component can send or handle Internet Control Message Protocol traffic, typically for functions such as network reachability checks, latency measurement, and diagnostic messaging alongside its core communication features. For software developers, this is useful because it helps applications verify whether endpoints are available, detect network issues earlier, improve monitoring and troubleshooting, and support more responsive connection logic without requiring separate tooling, which can make distributed systems and network-aware applications easier to observe and maintain.
Several .NET Comms & Messaging components offer ICMP support including:
For an in-depth analysis of features and price, visit our comparison of .NET Comms & Messaging components.
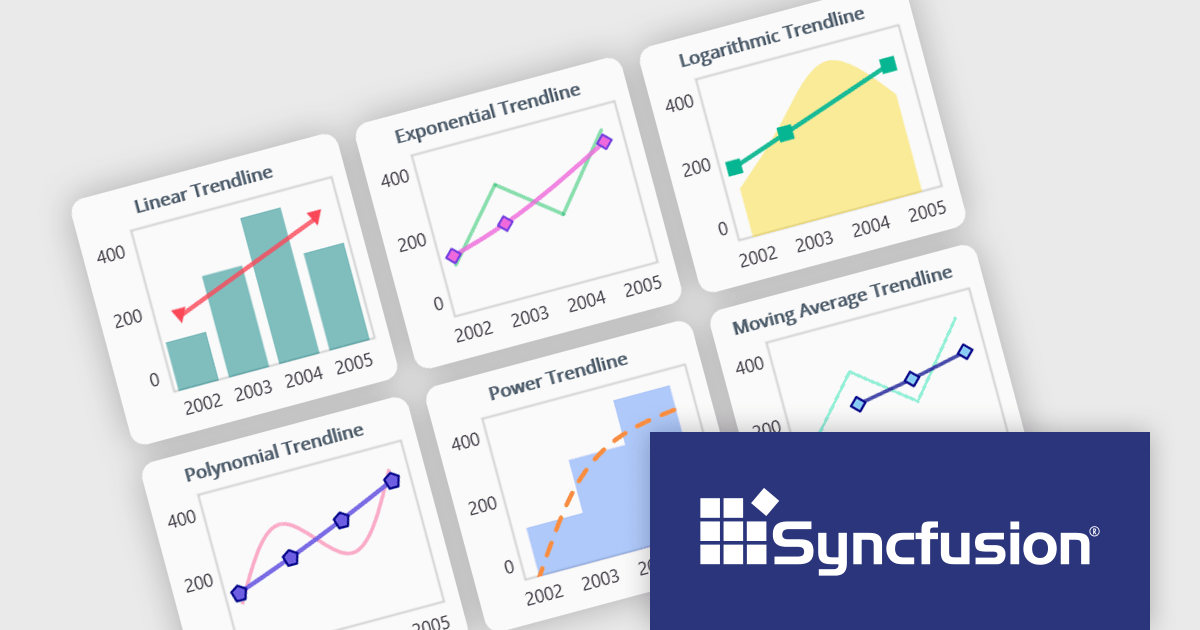
Syncfusion Essential Studio Enterprise provides a comprehensive collection of UI components and frameworks for building modern cross-platform applications. It offers over 1,800 components compatible with .NET WinForms, WPF, ASP.NET Core & MVC, WinUI, MAUI, JavaScript, Blazor, and more, enabling seamless application development across diverse devices and operating systems.
The Syncfusion Essential Studio 2026 Volume 1 update introduces trendline support to its MAUI charts, enabling developers to incorporate analytical context directly into data visualizations by applying linear, exponential, power, and polynomial models to chart series. This functionality allows applications to present clearer data patterns, support basic forecasting, and improve interpretability without requiring additional data processing logic or external tools, helping developers deliver more informative, insight-driven user experiences.
To see a full list of what's new in 2026 Volume 1 (33.1.44), see our release notes.
Syncfusion Essential Studio Enterprise is licensed per developer and is available as a 12 Month Timed Subscription License which includes support and maintenance. See our Syncfusion Essential Studio Enterprise licensing page for full details.
Learn more on our Syncfusion Essential Studio Enterprise product page.
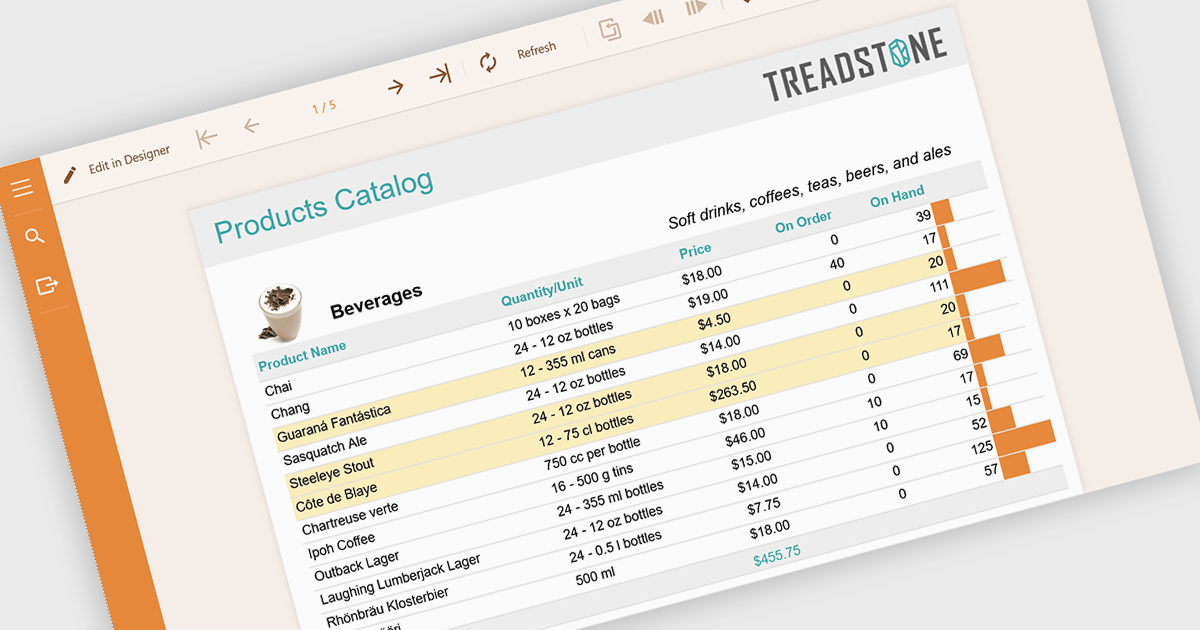
Conditional formatting in reports refers to the automatic application of visual styles such as colours, icons, or data bars based on specific rules or values within the data. This technique enhances reporting by making key information immediately visible, improving readability, and enabling faster, more informed decision making. By dynamically highlighting thresholds, trends, and anomalies, conditional formatting reduces the need for manual analysis while ensuring consistency across reports. Common use cases include flagging underperforming KPIs in financial dashboards, highlighting overdue tasks in project reports, visualising sales performance against targets, and identifying outliers in large datasets. Overall, it transforms static data into intuitive, actionable insights that are easier for users to interpret at a glance.
Several .NET reporting components allow you to apply conditional formatting, including:
For an in-depth analysis of features and price, visit our comparison of .NET reporting components.
Aspose.LLM for .NET is a library that enables developers to integrate large language model (LLM) capabilities directly into .NET applications with minimal complexity. It provides a structured and developer-friendly API for working with AI-driven text generation, summarization, and conversational scenarios, allowing teams to incorporate intelligent features without needing deep expertise in machine learning.
Aspose.LLM for .NET can be applied across a wide range of practical scenarios where intelligent text processing adds value to applications. It is well suited for building conversational interfaces such as chatbots and virtual assistants, as well as automating content generation for reports, documentation, and customer communications. Development teams can also use it to implement features like text summarization, sentiment analysis, and knowledge extraction from large datasets.
Aspose.LLM for .NET is offered as Developer Small Business, Developer OEM, Developer SDK, Site Small Business, Site OEM and Site SDK licenses catering to a range of business needs. Licenses are perpetual, and include 1 year of support and maintenance. Subscription renewals are also available. See our Aspose.LLM for .NET licensing page for full details.
Aspose.LLM for .NET is available individually or as part of the following products:


Tel: (888) 850 9911
Fax: +1 770 250 6199


