








Official Supplier
As official and authorized distributors, we supply you with legitimate licenses directly from 200+ software publishers.
See all our Brands.
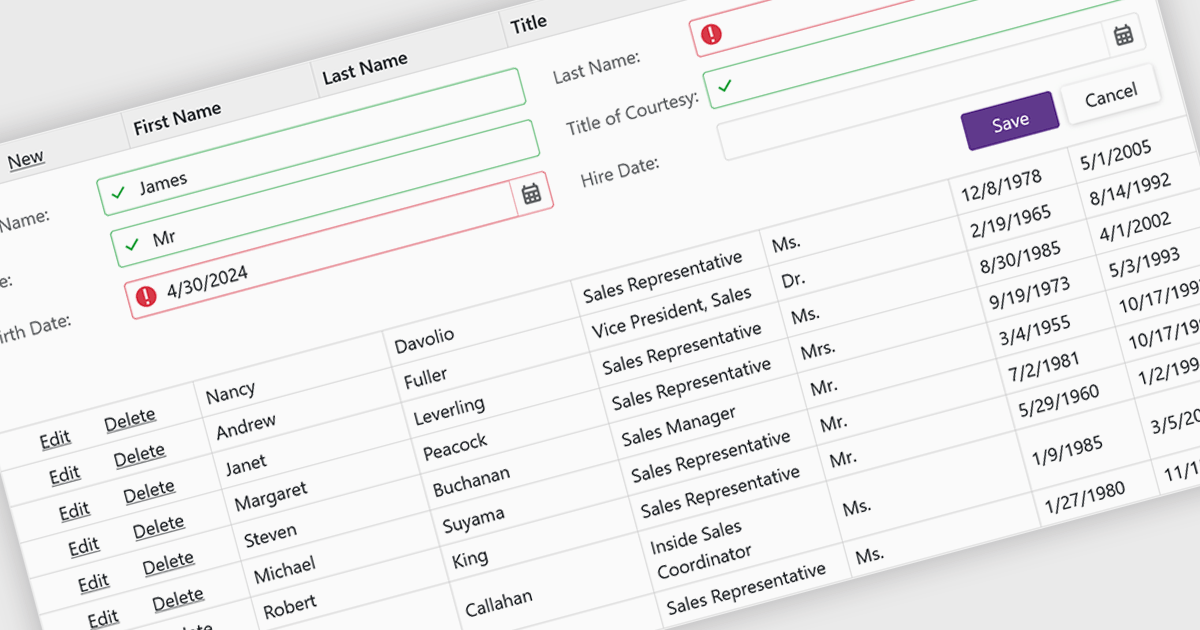
Data validation ensures the accuracy and integrity of information entered by users. It involves implementing rules to verify data against specific criteria, such as data type, format, or range. This helps prevent errors during data entry, improves data consistency, and safeguards against invalid information skewing analysis or downstream processes. Data validation is crucial in various scenarios, including managing financial records, maintaining customer databases, and ensuring data quality for scientific research.
Several Blazor grid controls offer data validation support including:
For an in-depth analysis of features and price, visit our Blazor Grid controls comparison.
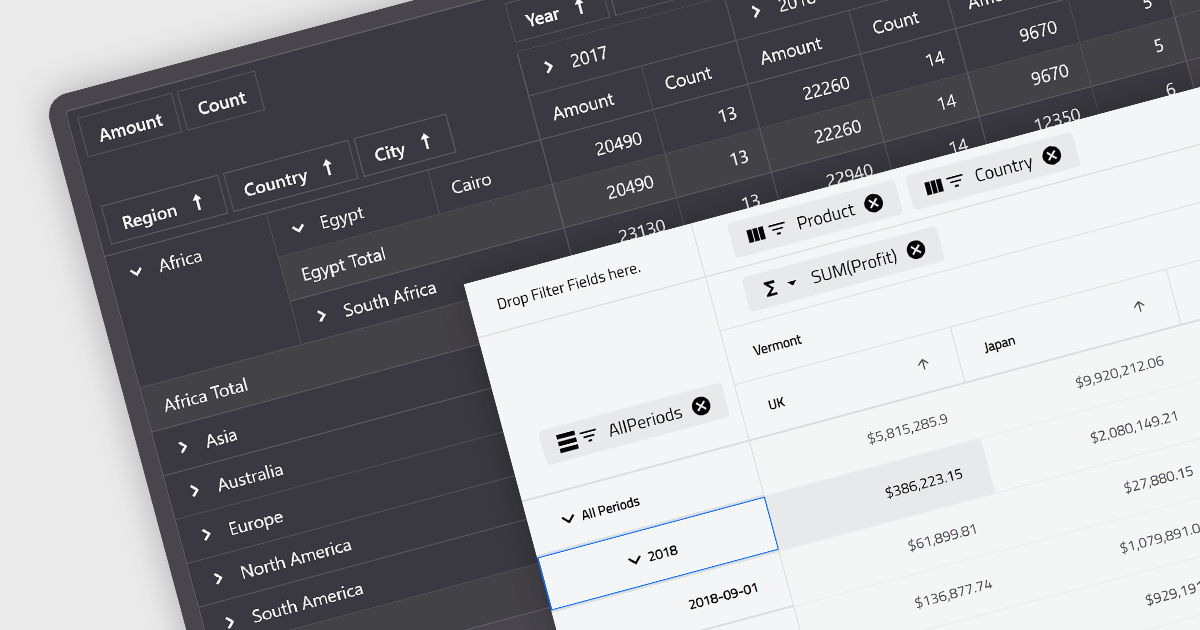
A pivot grid is a powerful data analysis tool that allows you to dynamically summarize and reorganize large datasets. By dragging and dropping fields, you can quickly create a new table that groups and calculates values based on different categories, revealing trends and patterns within your data. This interactive functionality makes pivot grids ideal for gaining insights and informing data-driven decisions. Common use cases include financial analysis, marketing campaign evaluation, and sales performance exploration.
Several Blazor UI suites feature a pivot grid control including:
For an in-depth analysis of features and price, visit our Blazor UI suites comparison.

DevExpress .NET MAUI is a UI component library specifically designed to enhance the development of native mobile applications for iOS and Android using .NET MAUI and C#. It offers a rich set of pre-built controls like data grids, charts, schedulers, and various data editors, allowing developers to focus on application logic and deliver feature-rich mobile experiences with a faster development cycle.
In this blog post, DevExpress technical writer Anthony Sameishchev shows you how to use DevExpress .NET MAUI to implement Material Design 3 themes in your mobile applications. Detailed sample code is included, demonstrating how to:
Material Design 3 principles help you deliver mobile solutions with a consistent and modern appearance. The 10 built-in Material Design 3 color themes included in DevExpress .NET MAUI enable you to easily support these themes in applications using DevExpress or standard MAUI controls.
Read the complete blog and learn how to create stunning UIs with balanced colors and enhanced usability.
DevExpress .NET MAUI is included as part of DevExpress Universal which is licensed per developer and is available as a Perpetual License with a 12 month support and maintenance subscription. See our DevExpress Universal licensing page for full details.
For more information, visit our DevExpress .NET MAUI product page.
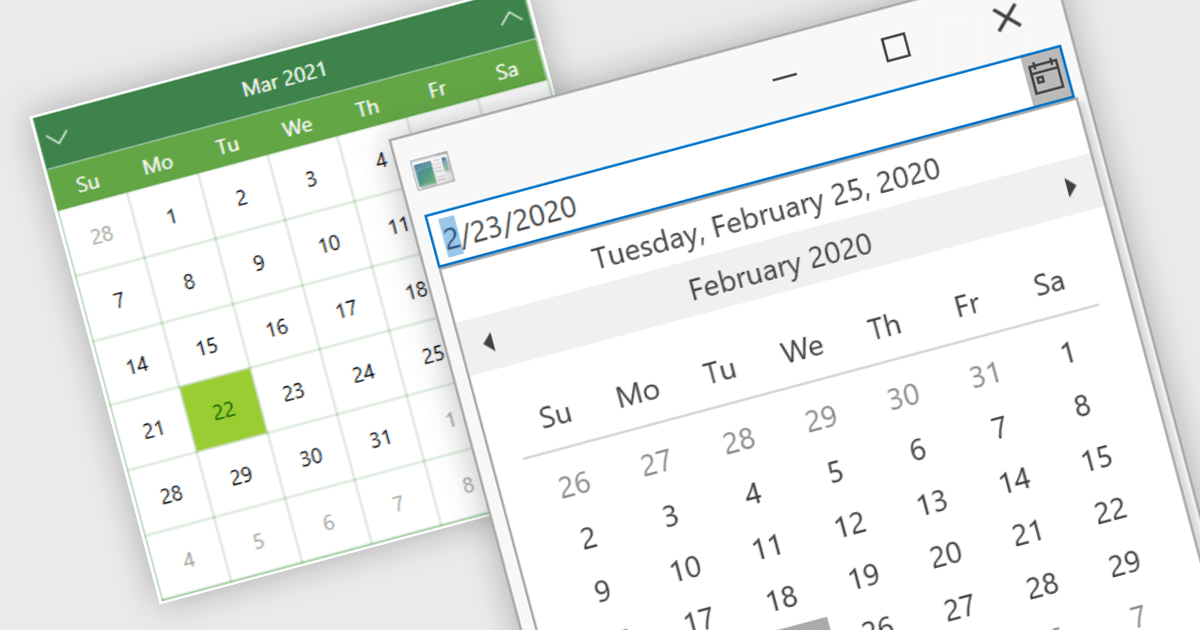
Calendar data entry components provide a familiar interface that allows users to visually navigate through days, months, and years, making it easier to find specific dates. They can also support features like multi-date selection or blackout dates for unavailable options. This functionality improves data entry accuracy and reduces the need for manual code to manage date operations, streamlining development workflows and potentially reducing errors.
Many .NET 8 WPF data editor collections contain calendar functionality including:
For an in-depth analysis of features and price, visit our comparison of .NET 8 WPF Data Editors.
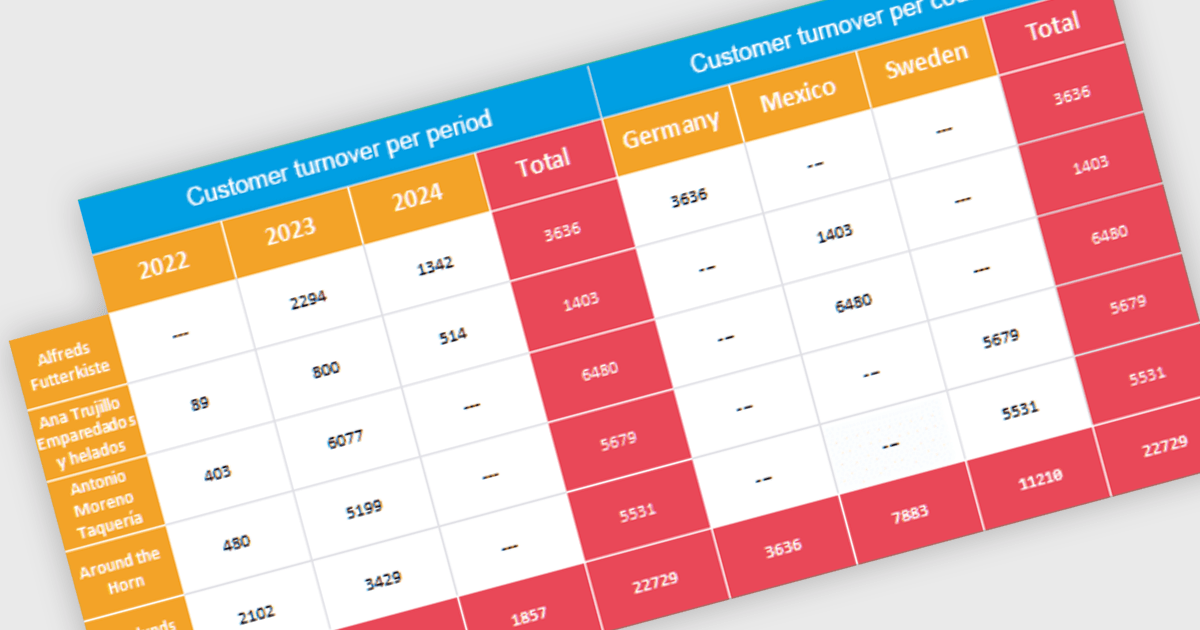
Cross tabs, also known as crosstabulations or contingency tables, are a data visualization technique used in reporting to reveal relationships between two or more categorical variables. By organizing data in a grid with categories on rows and columns, Cross tabs allow users to quickly spot patterns that might not be obvious in standard report formats. This is particularly useful for tasks like understanding user demographics or segmenting customer behavior.
Several .NET WPF Reporting Controls offer cross tabs including:
For an in-depth analysis of features and price, visit our comparison of .NET WPF Reporting Controls.





Tel: (888) 850 9911
Fax: +1 770 250 6199


