


Official Supplier
As official and authorized distributors, we supply you with legitimate licenses directly from 200+ software publishers.
See all our Brands.
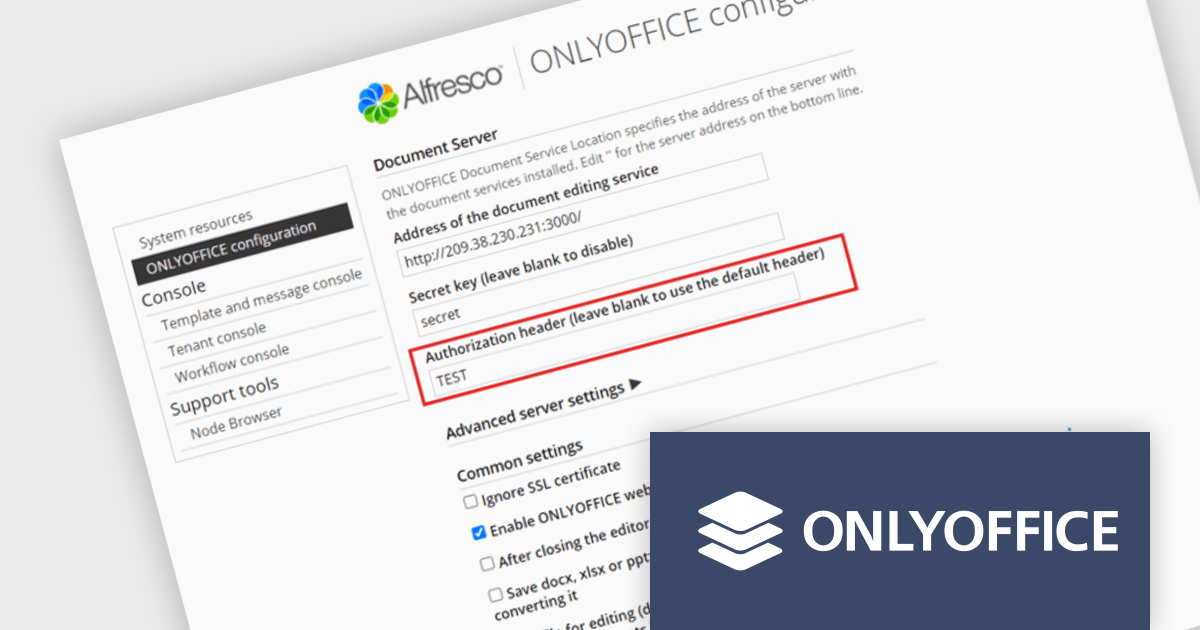
ONLYOFFICE Docs Enterprise Edition with Alfresco Connector combines an online document editor with a seamless integration for Alfresco Share, which is a content management platform that allows users to store, organize, and collaborate on documents and other digital assets. This integration allows teams to create, view, edit, and collaborate on spreadsheets, presentations, and text files online, directly within Alfresco Share using ONLYOFFICE editors, boosting efficiency and eliminating the need for file switching.
The ONLYOFFICE Alfresco Connector 7.0 update (available as part of ONLYOFFICE Docs Enterprise Edition with Alfresco Connector v8.0.1) adds advanced security options. It now uses JSON Web Token Secret and JSON Web Token Header to safeguard against unauthorized access, providing a higher level of protection. This release also gives administrators the flexibility to configure their own authorization headers directly on the editor's settings page, thereby offering a more tailored and secure document management experience.
To see a full list of what's new in ONLYOFFICE Docs Enterprise Edition v8.0.1 with Alfresco Connector 7.0, see our release notes.
ONLYOFFICE Docs Enterprise Edition with Alfresco Connector is licensed per server and is available as an annual license with 1 year of support and updates, or as a perpetual license with 3 years of support and updates. See our ONLYOFFICE Alfresco connector licensing page for full details.
For more information, see our ONLYOFFICE Alfresco connector product page.

Grial UI Kit by UXDivers is a collection of pre-designed user interface components and templates specifically built for Xamarin.Forms and .NET MAUI app development. It offers a wide range of customizable XAML code snippets, custom controls, and helpers, allowing developers to rapidly build modern and visually appealing mobile applications for Android and iOS platforms while focusing on the core functionalities of the app.
The Grial UI Kit 4.2.114 release introduces an enhanced Carousel component designed for displaying lists of elements with a familiar, swipeable interface. Inspired by .NET MAUI's CarouselView, the Carousel is a flexible UI component that allows for extensive customization of appearance, behavior, and animations. It offers features like pre-built animations, commands to notify view models of carousel state changes, MVVM compatibility for data binding, optimized performance with virtualization, and a comprehensive API for controlling looping, positioning, item appearance, dragging, events, and integration with Grial's Progressive Animations.
To see a full list of what's new in 4.2.114.0, see our release notes.
Grial UI Kit is licensed per application and is available as an perpetual license. See our Grial UI Kit licensing page for full details.
For more information, see our Grial UI Kit product page.
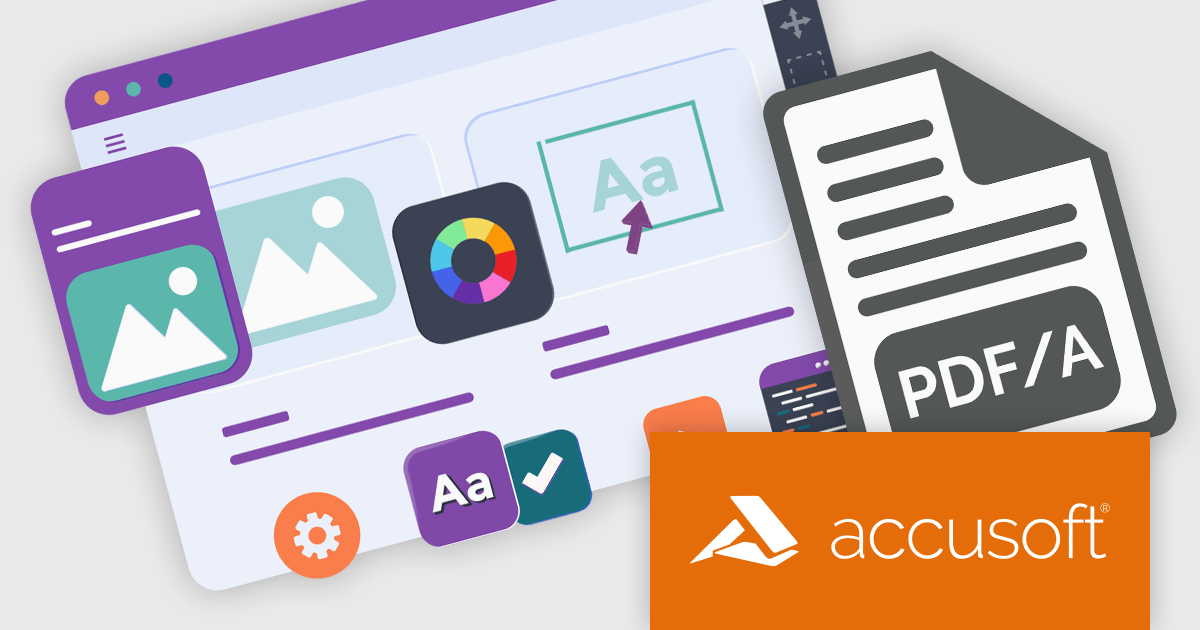
ImageGear for .NET by Accusoft is a development toolkit that empowers you to add robust image processing and document handling functionalities to your .NET applications. It provides comprehensive support for a wide range of file formats, including common image types, PDFs, DICOM medical images, and even Microsoft Office files. ImageGear offers functionalities such as conversion, editing, annotation, viewing, and OCR, streamlining your development process for document-centric applications.
The ImageGear for .NET v26.4.0 update streamlines PDF archiving with the introduction of a RESTful PDF to PDF/A Converter API. This API empowers your applications to seamlessly convert any PDF document into a fully PDF/A compliant archive format. This ensures long-term accessibility and fidelity of your documents, meeting industry standards for preservation.
To see a full list of what's new in v26.4.0, see our release notes.
ImageGear for .NET is licensed per developer and is available as an annual license with 12 months support and upgrades. See our ImageGear for .NET licensing page for full details.
For more information, see our ImageGear for .NET product page.
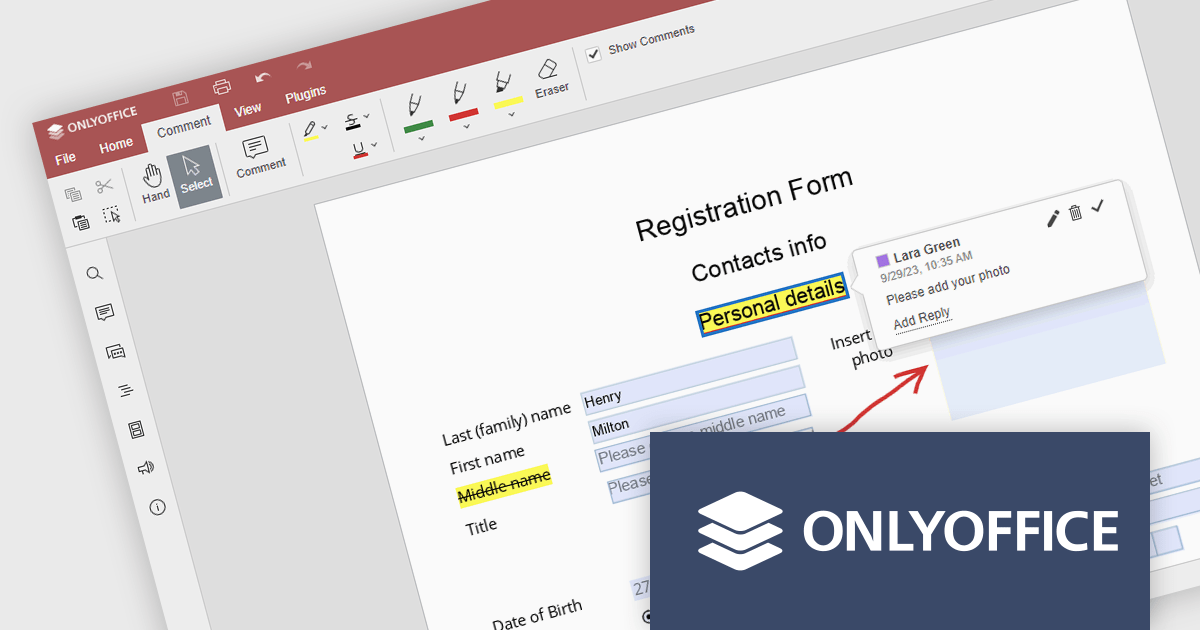
ONLYOFFICE Docs Enterprise Edition with WordPress Connector combines an online document editor with a seamless integration for WordPress, which is a content management system for creating and managing websites. This allows teams to create, view, edit, and collaborate on spreadsheets, presentations, and text files online, directly within WordPress, boosting efficiency and eliminating the need for file switching.
The ONLYOFFICE WordPress Connector 2.0.0 release (available as part of ONLYOFFICE Docs Enterprise Edition with WordPress Connector v8.0.1) brings the ability to open PDF files uploaded to your WordPress site directly within the admin dashboard for form filling and annotating using ONLYOFFICE Docs. You can fill out interactive fields, highlight, underline and strikethrough text, leave comments, and draw different objects and lines with the built-in drawing tools. By enabling seamless interactions with PDF documents directly within the platform and reducing the steps needed to edit or comment on PDF files, this capability streamlines document management workflows, optimizes productivity and eliminates the need for external software solutions.
To see a full list of what's new in ONLYOFFICE Docs Enterprise Edition v8.0.1 with WordPress Connector 2.0.0, see our release notes.
ONLYOFFICE Docs Enterprise Edition with WordPress Connector is licensed per server and is available as an annual license with 1 year of support and updates, or as a perpetual license with 3 years of support and updates. See our ONLYOFFICE WordPress connector licensing page for full details.
For more information, see our ONLYOFFICE WordPress connector product page.
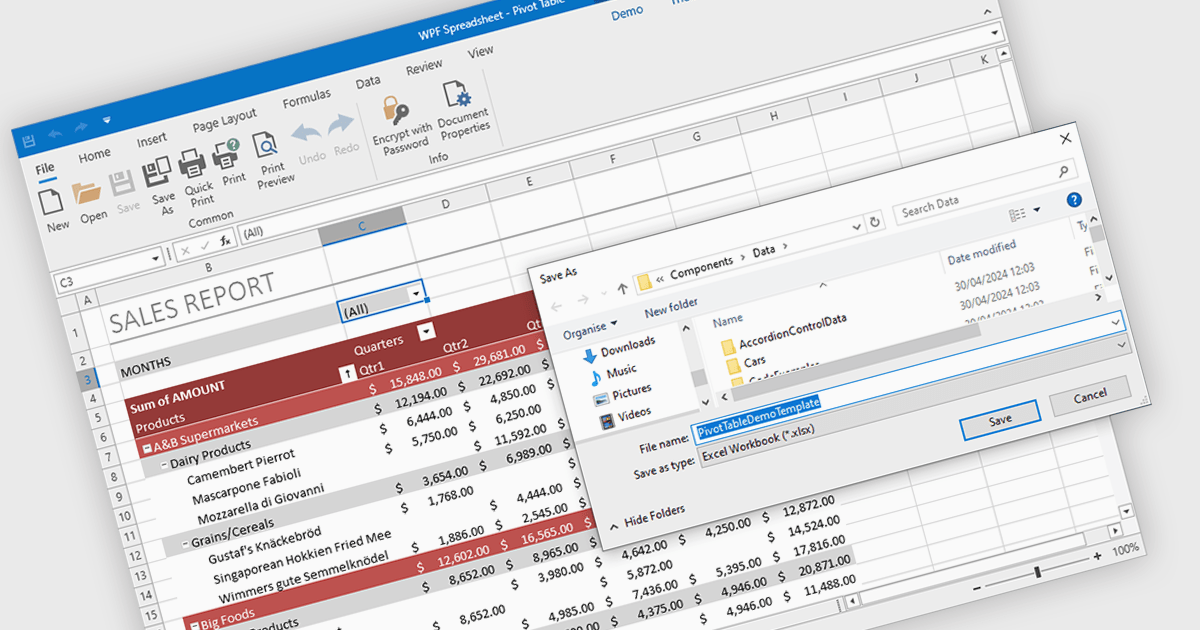
Spreadsheet components with XLSX export functionality allow developers to seamlessly save spreadsheet data and formatting from their application as a Microsoft Excel compatible file. This functionality provides significant benefits such as increased data portability for users who can then open and edit the spreadsheets in Excel, and improved collaboration as data can be easily shared and worked on across different platforms.
Several WPF spreadsheet controls offer the ability to export XLSX files including:
For an in-depth analysis of features and price, visit our WPF spreadsheet controls comparison.


Tel: (888) 850 9911
Fax: +1 770 250 6199


