


Official Supplier
As official and authorized distributors, we supply you with legitimate licenses directly from 200+ software publishers.
See all our Brands.
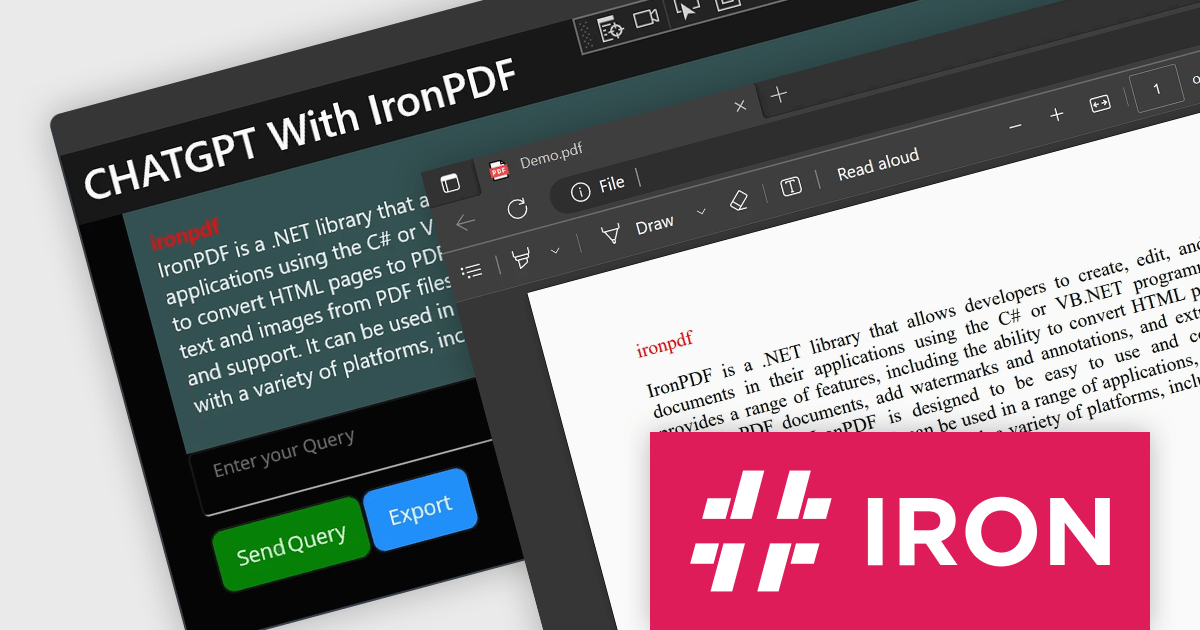
IronPDF for .NET empowers developers with a user-friendly C# library to generate, edit, and manage PDFs. It leverages a familiar HTML/CSS foundation for effortless PDF creation, while also offering robust features like text extraction, OCR, signing, and more. This comprehensive solution simplifies complex PDF development tasks, saving time and boosting productivity for .NET projects.
The IronPDF for .NET 2024.1.20 release unleashes the power of ChatGPT directly within your PDF workflows through the IronPdf.Extensions.AI NuGet package. This seamless integration with OpenAI unlocks a world of possibilities, from automating tasks and extracting insights with advanced AI models to summarizing documents, making intelligent queries, and even crafting PDFs fueled by artificial intelligence. This new functionality requires you to use your own OpenAI API key.
To see a full list of what's new in v2024.1.20, see our release notes.
IronPDF for .NET is licensed based on the number of developers, organization locations and projects, and is available as a Perpetual license with one free year of product updates and support services. See our IronPDF for .NET licensing page for full details.
IronPDF for .NET is available to buy in the following products:
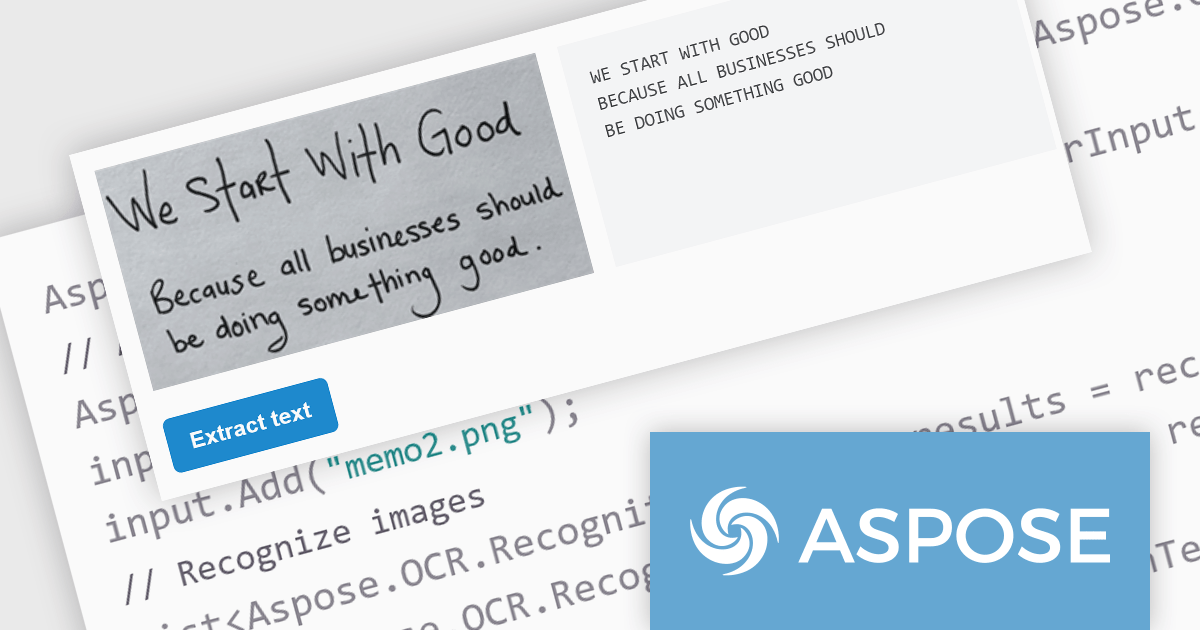
Aspose.OCR for .NET empowers developers with a robust, API-driven optical character recognition (OCR) solution for their .NET applications. It seamlessly extracts machine-readable text from diverse image formats, including scans, photos, and PDFs, across 28 languages. Boasting superior speed and accuracy, even with tilted or noisy images, it eliminates the need for complex algorithm expertise, allowing developers to focus on application logic and value creation.
The 23.12.1 release of Aspose.OCR for .NET adds the ability to recognize handwritten text. Beyond simply recognizing text from images, it empowers users to digitize historical records, streamline document archiving, analyze customer feedback, and parse employee records—all while accurately interpreting handwritten input. This cutting-edge solution fosters new levels of efficiency and insight, transforming the way we interact with written information.
To see a full list of what's new in version 23.12.1, see our release notes.
Aspose.OCR for .NET is offered as Developer Small Business, Developer OEM, Site Small Business, and Site OEM licenses, catering to a range of business needs. Licenses are perpetual, and include 1 year of support and maintenance. Subscription renewals are also available. See our Aspose.OCR for .NET licensing page for full details.
For more information, visit our Aspose.OCR for .NET product page.
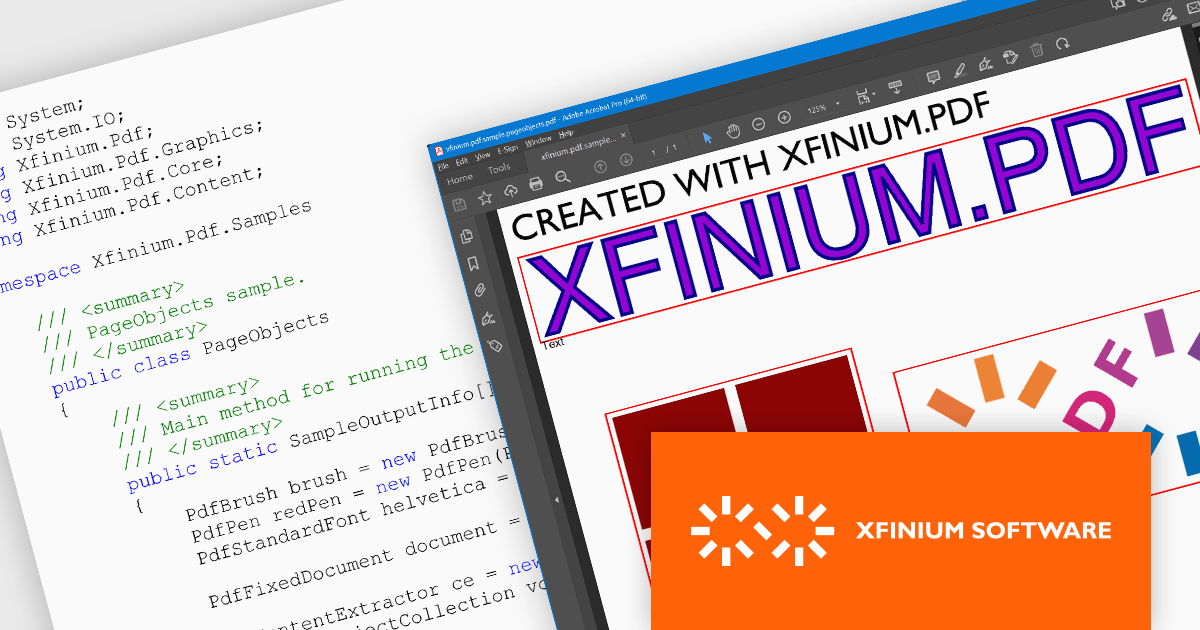
XFINIUM.PDF CROSS-PLATFORM BUNDLE is a software development library that lets you write PDF applications once and run them natively on multiple platforms, including .NET, Windows Forms, and Xamarin. This eliminates the need for separate codebases for each platform, saving you time and effort while ensuring consistent functionality across devices.
The XFINIUM.PDF CROSS-PLATFORM BUNDLE V12.2.2 release adds support for .NET 8. This allows developers to enjoy the performance boosts, enhanced cross-platform compatibility, and new APIs in the latest version of Microsoft's popular development framework.
To see a full list of what's new in version 12.2.2, see our release notes.
XFINIUM.PDF CROSS-PLATFORM BUNDLE is licensed per developer and is run-time royalty free. All licenses include a 12 month subscription which provides all major and minor product updates and technical support.
See our XFINIUM.PDF CROSS-PLATFORM BUNDLE licensing page for full details.
For more information, visit our XFINIUM.PDF CROSS-PLATFORM BUNDLE product page.
Syncfusion Essential Studio .NET MAUI, available as part of Syncfusion Essential Studio Enterprise, empowers developers with a comprehensive suite of native UI controls, data visualization tools, and performance optimizations for building modern, cross-platform mobile and desktop applications. This professional-grade toolkit leverages the power of C# and XAML, enabling rapid development of stunning and responsive experiences across diverse platforms.
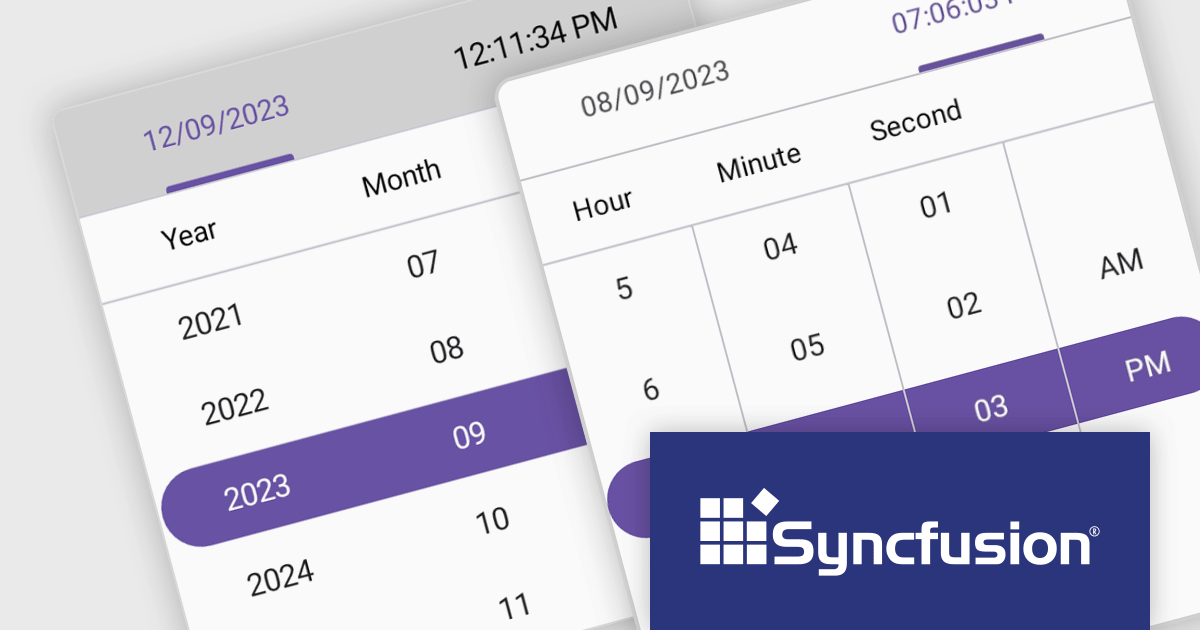
The Syncfusion Essential Studio .NET MAUI 2023 Volume 4 (24.1.41) release adds a new Date Time Picker component. This lets users effortlessly select dates, times, or both, and boasts impressive features like different picker modes (inline, popup, and relative), extensive date and time formatting options, minimum and maximum date restrictions, and granular customization of headers, columns, footers, and selection views. This versatile tool helps you build intuitive and visually appealing UIs for capturing date and time data with ease.
To see a full list of what's new in version 2023 Volume 4 (24.1.41), see our release notes.
Syncfusion Essential Studio .NET MAUI is available as part of Syncfusion Essential Studio Enterprise which is licensed per developer starting with a Team License of up to five developers. It is available as a 12 Month Timed Subscription License which includes support and maintenance. See our Syncfusion Essential Studio Enterprise licensing page for full details.
For more information, visit our Syncfusion Essential Studio .NET MAUI product page.
Editing PDFs programmatically allows developers to transcend manual manipulation and embrace code-driven control. By leveraging dedicated libraries and C#, applications can now extract data, update content, and dynamically generate complex documents, all without user intervention. This unlocks profound efficiency gains, automates repetitive tasks, and empowers developers to integrate sophisticated document automation directly into their .NET workflows.
Several .NET components support programmatic editing of PDFs including:
For an in-depth analysis of features and price, visit our .NET PDF Components comparison.


Tel: (888) 850 9911
Fax: +1 770 250 6199


