


Official Supplier
As official and authorized distributors, we supply you with legitimate licenses directly from 200+ software publishers.
See all our Brands.
ComponentOne Studio Enterprise is a comprehensive suite of .NET UI controls developed by MESCIUS (formerly GrapeCity) designed for building rich, interactive desktop, web, and mobile applications. It provides developers with a broad range of tools and components-including data grids, charts, reports, input controls, and advanced data visualization features-for platforms such as WinForms, WPF, ASP.NET Core, Blazor, WinUI, and .NET MAUI. The suite emphasizes performance, flexibility, and ease of integration, helping teams create consistent, feature-rich user experiences across multiple application types while maintaining a unified development approach.
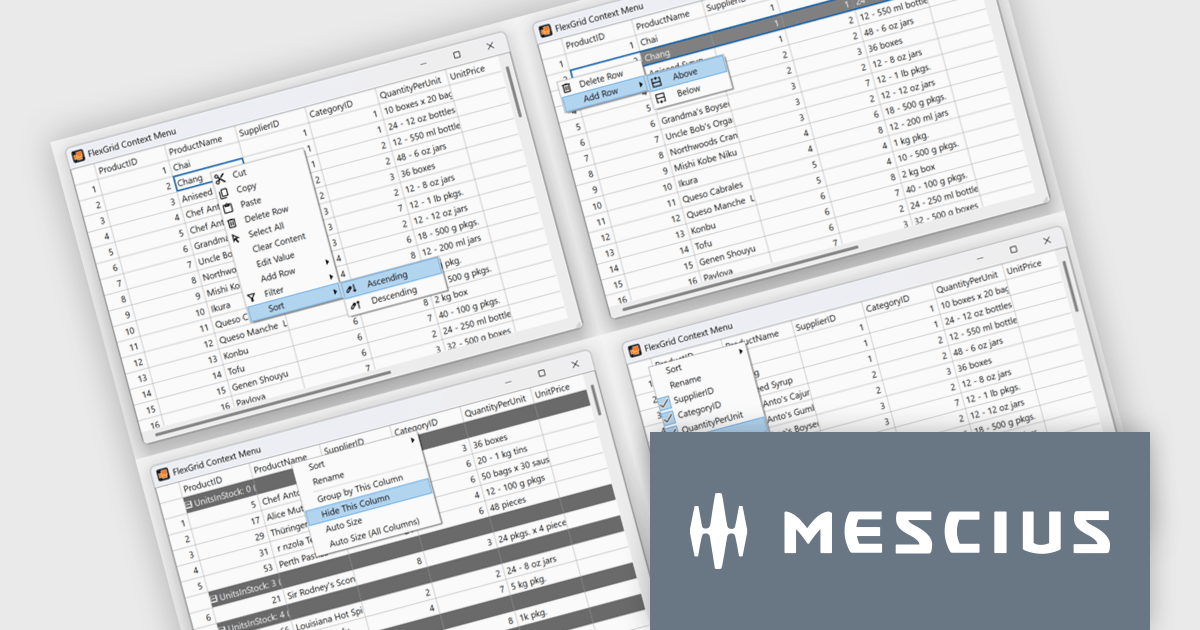
The ComponentOne 2025 v1.2 update includes a new sample demonstrating a complete, custom context menu solution for FlexGrid. It allows developers to define context-aware actions that adapt to different parts of the grid. This enables right-click functionality to insert rows, sort or group columns, and open a column picker directly within the grid. Developers benefit from the flexibility of FlexGrid’s API to implement tailored solutions while providing end users with a familiar, Excel-like experience that enhances efficiency and precision in data management tasks.
To see a full list of what's new in 2025 v1.2, see our release notes.
ComponentOne Studio Enterprise is licensed per developer on a perpetual basis and includes a 12 month subscription. Priority Support is also available. See our ComponentOne Studio Enterprise licensing page for full details.
Learn more on our ComponentOne Studio Enterprise product page.
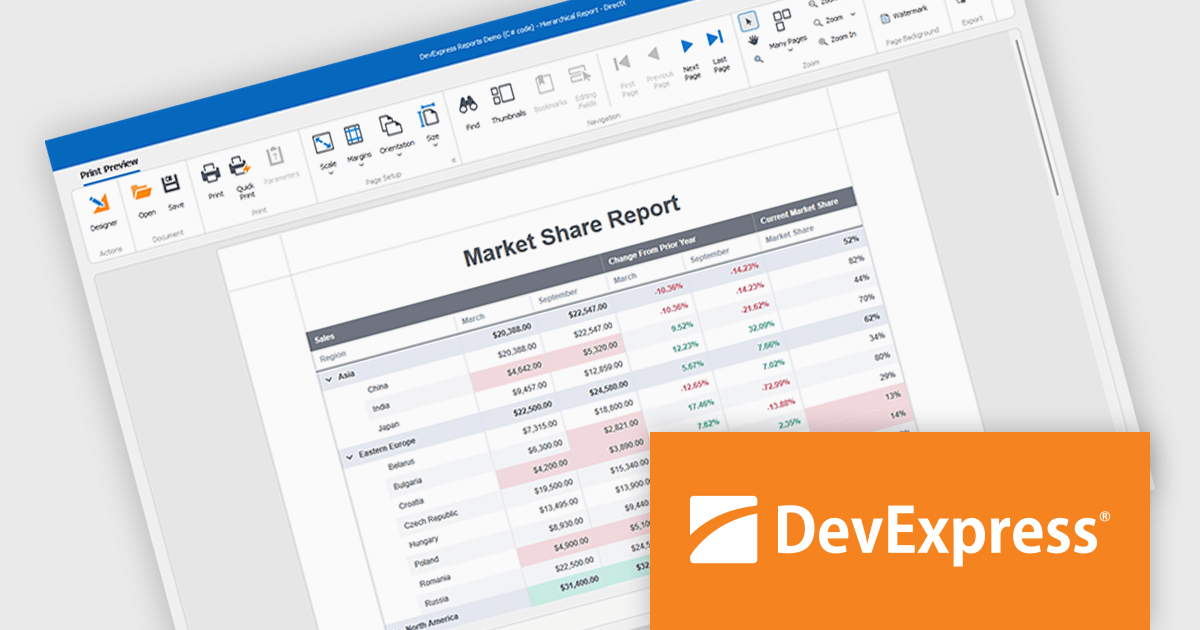
DevExpress Reporting is a comprehensive suite of reporting tools that help developers create visually stunning and highly customizable reports for various applications. With its rich feature set, including data binding, layout design, printing, and exporting capabilities, DevExpress Reporting enables the efficient creation of reports that meet the most demanding business requirements.
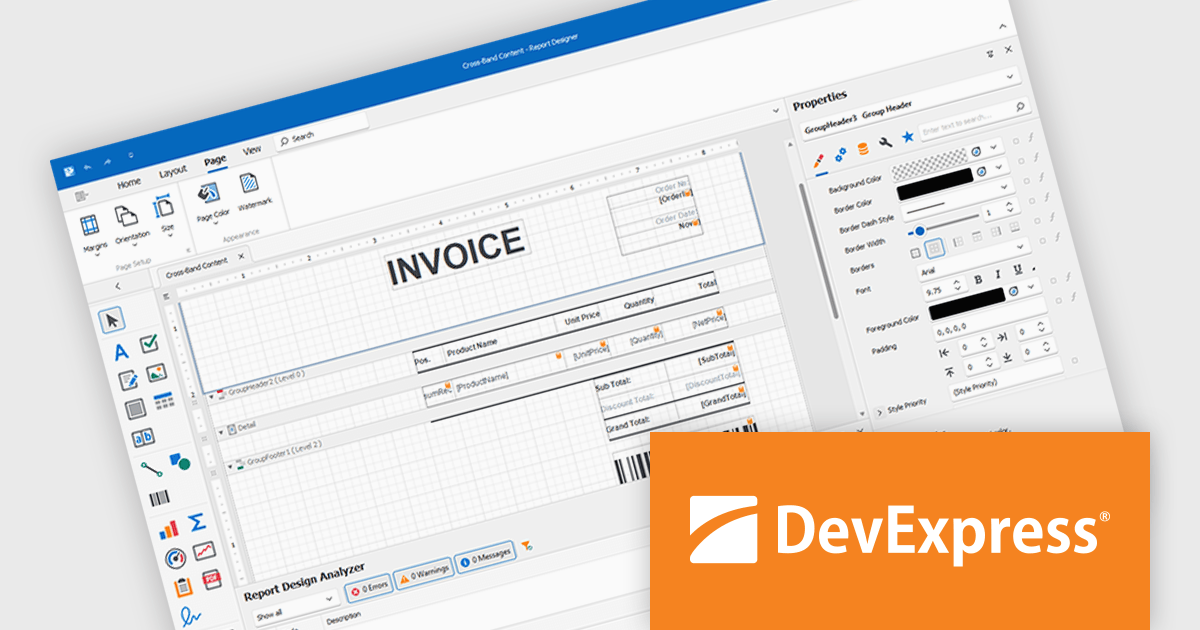
DevExpress Reporting lets developers build custom report controls that go beyond the built-in options, making it easier to meet specific project needs. These controls can include unique visual elements or functions that fit naturally into the existing reporting setup, keeping reports consistent in both appearance and behavior. Custom controls also help standardize design, support reusable logic, and handle specialized data presentation that standard controls may not cover, improving maintainability and scalability over time.
DevExpress Reporting is licensed per developer and is available as a Perpetual License with a 12 month support and maintenance subscription. See our DevExpress Reporting licensing page for full details.
DevExpress Reporting is available to buy in the following products:
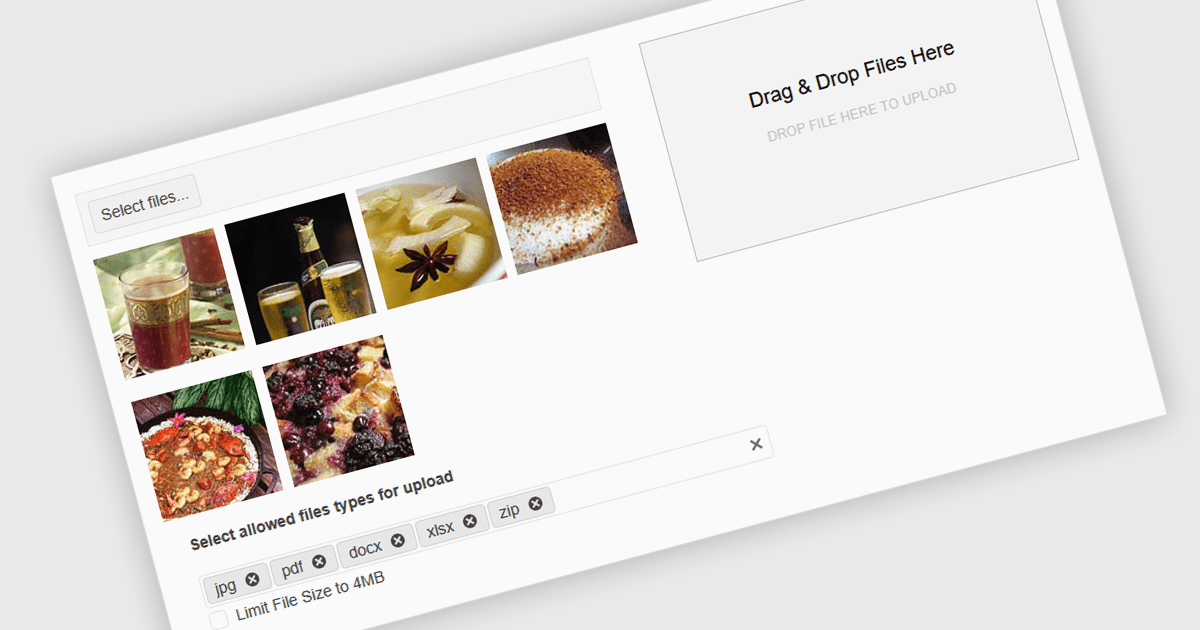
Queuing multiple files for upload in .NET components refers to the ability to stage several files for transfer either sequentially or in parallel, rather than requiring each to be uploaded individually. This capability is especially valuable in applications where users need to upload large sets of files - such as images, documents, or backups - without manually initiating each upload. It enhances efficiency by automating the process, supporting better resource management and enabling features such as progress tracking, retry mechanisms, and batch error handling. When integrated with protocols like FTP (File Transfer Protocol), this feature becomes critical for systems that handle bulk file distribution, content management, or remote data archiving. For instance, a content management system might allow editors to upload an entire gallery at once, while a backup tool could automatically queue system logs for nightly FTP transfer.
Several .NET Comms & Messaging components support queuing multiple files for upload including:
For an in-depth analysis of features and price, visit our comparison of .NET Comms & Messaging components.
Telerik Report Server is a comprehensive and flexible end-to-end solution for managing reports. Built with the Telerik Reporting library, it is a server-based Windows web application that provides centralized storage, organization, and previewing of reports, along with features for scheduling, delivery, and user management. Report Server can act as a standalone solution or be integrated within an application, allowing developers to create, manage, and distribute reports across multiple platforms including Blazor, Angular and Windows Forms.
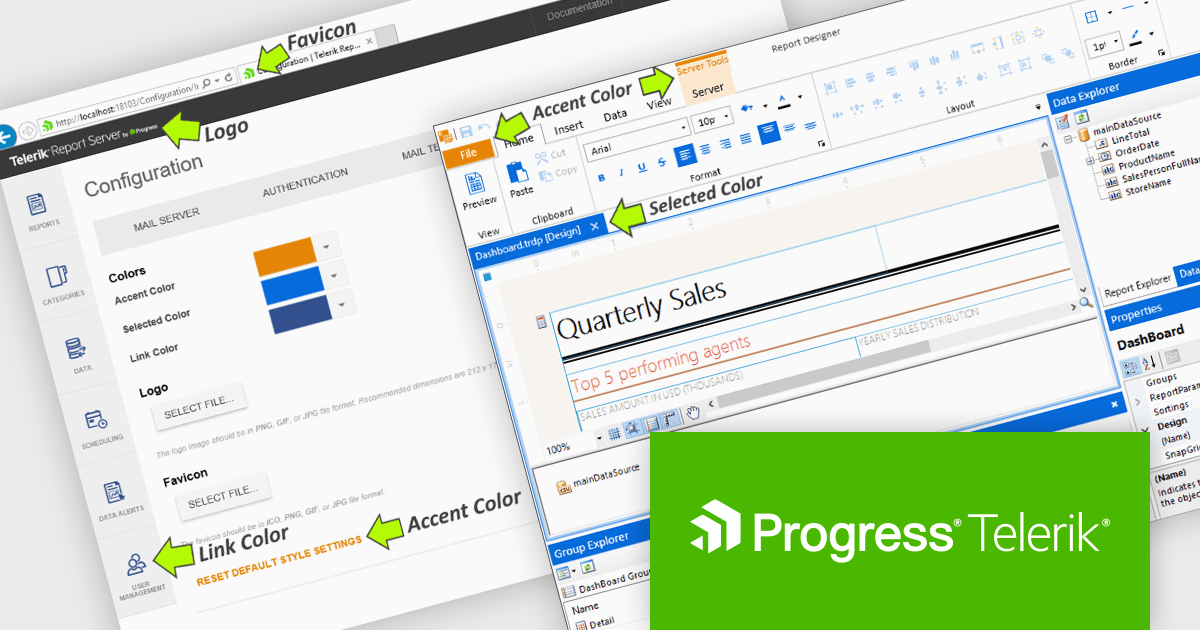
The Telerik Report Server 2025 Q3 update introduces white-labeling, allowing development teams to align the Report Server web application and Standalone Report Designer with their organization’s visual standards. This capability enables administrators to replace default branding elements such as colors, logos, and favicons with enterprise-specific assets, creating a consistent user interface across internal systems. By integrating into existing environments, the update helps reduce visual fragmentation, improve user trust, and improve the experience for both internal and external stakeholders.
To see a full list of what's new in 2025 Q3 (11.2.25.813), see our release notes.
Telerik Report Server is licensed per developer and has two licensing models: an annual Subscription License and a Perpetual License. The Subscription license provides access to the latest product updates, technical support, and exclusive benefits for a flat annual fee, and must be renewed to continue using the software. The Perpetual license is a one-time purchase granting access to the current released version and includes a one-year subscription for product updates and technical support. After this initial period, users can choose to renew the subscription element to continue receiving updates and support; otherwise, they may continue using the installed version available during their active subscription term but will forgo future updates and support. See our Telerik Report Server licensing page for full details.
Telerik Report Server is available individually or as part of Telerik DevCraft Ultimate.
DevExpress WinForms is a comprehensive suite of 190+ UI controls and development tools designed for building high-performance desktop applications. It offers a broad array of customizable controls, from data grids and ribbon interfaces to advanced charts, maps, and diagramming components. This empowers developers to rapidly create functionally rich applications, while adhering to accessibility guidelines and touch-enabled technology for modern Windows environments.
DevExpress WinForms provides advanced analytics in reporting to help developers build data-driven applications that deliver deeper insights. It enables dynamic data shaping, interactive exploration, and precise calculations within reports, allowing developers to incorporate conditional formatting, interactive sorting, filtering, grouping, drill-down navigation, calculated fields, parameters, and real-time summaries to create reports that adapt to user input, highlight key metrics, and support informed decision-making.
DevExpress WinForms is licensed per developer and is available as a Perpetual License with a 12 month support and maintenance subscription. See our DevExpress WinForms licensing page for full details.
DevExpress WinForms is available individually or in the following products:


Tel: (888) 850 9911
Fax: +1 770 250 6199


