








Official Supplier
As official and authorized distributors, we supply you with legitimate licenses directly from 200+ software publishers.
See all our Brands.
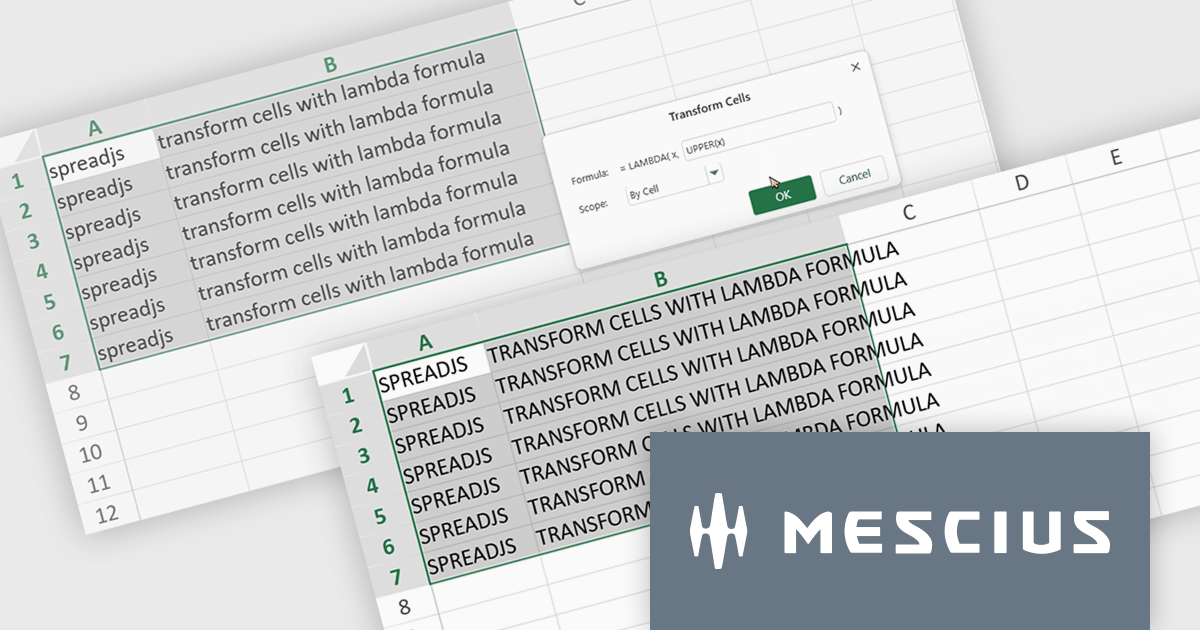
SpreadJS is a high-performance JavaScript spreadsheet and data presentation component designed for enterprise web applications. It enables developers to deliver Excel-like functionality directly within their web solutions, providing advanced features such as data binding, complex calculations, pivot tables, charts, and extensive formatting options. Fully compatible with modern JavaScript frameworks like React, Angular, and Vue, SpreadJS allows seamless integration and customization, empowering development teams to create interactive, data-driven user experiences without relying on external spreadsheet applications.
The SpreadJS 18.2 adds a new Transform command which enables you to apply LAMBDA functions directly to a selected range of cells and replace the original content with calculated results. This simplifies data transformations - whether mapping, filtering, or reshaping - into a clean, single-step process. With this feature, you can select any range and apply a custom LAMBDA formula - for example, converting units, adjusting values, or formatting entries - and have SpreadJS overwrite the selection with the computed results immediately. This removes manual steps like inserting formulas in separate cells, copying values, or pasting back as values. This feature integrates with SpreadJS’s existing LAMBDA capabilities to offer more interactive and efficient spreadsheet manipulation.
To see a full list of what's new in 18.2, see our release notes.
SpreadJS is licensed per developer and includes 1 Year Maintenance (major and minor version releases and unlimited support phone calls). SpreadJS requires an Annual or Perpetual Deployment License. The optional Add-ons are available at an additional cost, and require a SpreadJS license. See our SpreadJS licensing page for full details.
For more information, visit our SpreadJS product page.
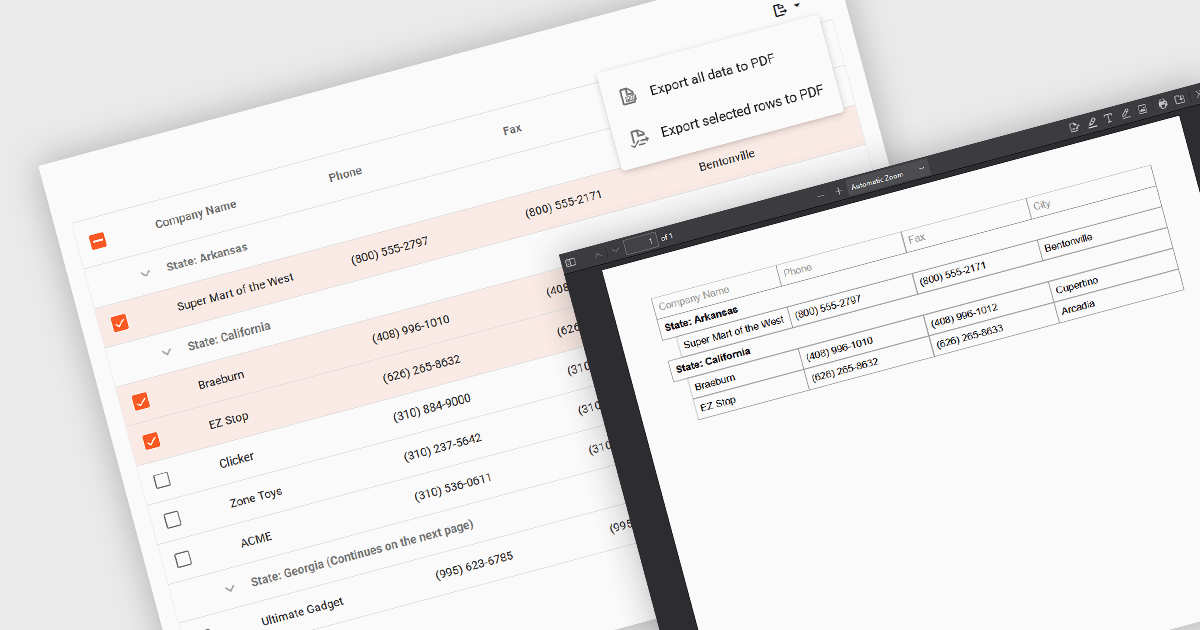
Export selection in a data grid is the ability to export only a defined range, the specific rows, columns or cells that a user has actively selected, rather than the entire dataset. This selective approach is particularly valuable when working with large data sets, as it allows users to extract and share only the most relevant subset of information without additional filtering or manual deletion after export. By reducing the volume of unnecessary data in exported files, it improves efficiency, helps maintain focus on the intended content, and can enhance security by avoiding the inclusion of sensitive or unrelated information. This targeted export capability is commonly used to output data in formats such as CSV, Excel, or PDF, supporting the integration of grid data into reporting and analysis processes.
Several Vue.js grid components allow you to export selections, including:
For an in-depth analysis of features and price, visit our comparison of Vue.js grid components.
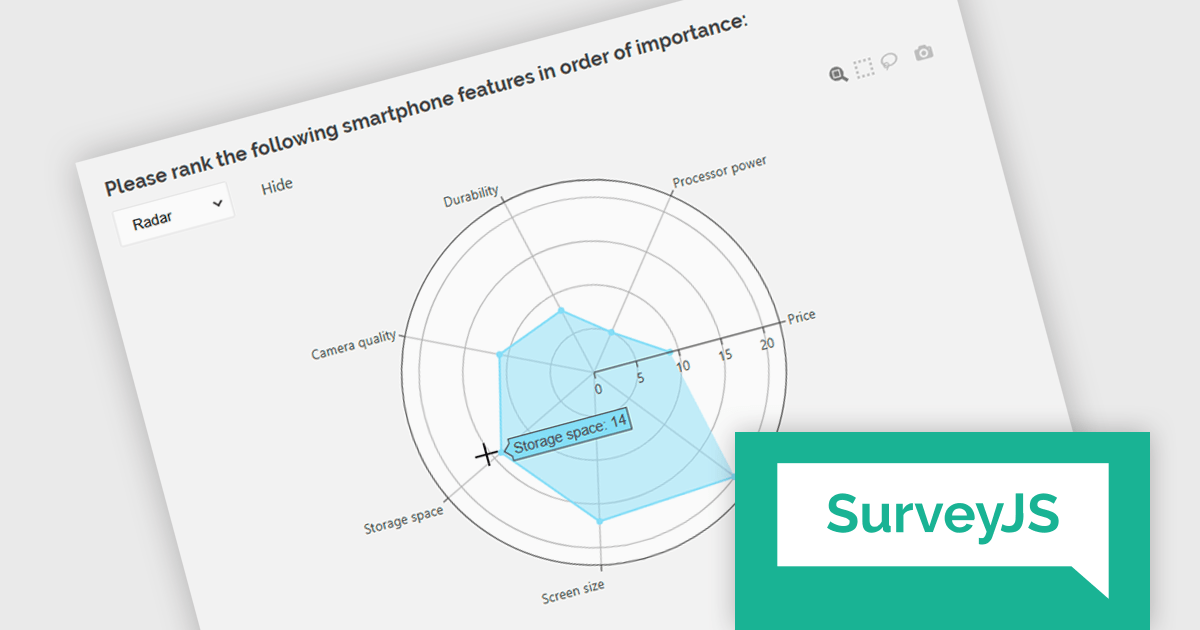
SurveyJS Dashboard is a JavaScript UI component that visualizes survey responses in real time using interactive charts and tables, helping teams analyze data quickly and efficiently. It integrates with any JavaScript framework, including Angular, React, Vue, and vanilla JS. The dashboard renders data based on JSON schemas created in Survey Creator and filled with responses from the Form Library. Its flexible, backend-independent design allows integration with any custom backend. With a variety of chart types, it supports use cases such as customer feedback, employee surveys, and market research by turning raw data into clear visual insights.
The SurveyJS Dashboard v2.3.0 update introduces support for radar charts, which developers can use to represent rank-based responses more intuitively, helping users gain clearer insights into survey data without additional configuration. This new chart type is automatically available for Ranking questions and can be selected directly from the chart type menu within the Dashboard.
To see a full list of what's new in version 2.3.0, see our release notes.
SurveyJS Dashboard is licensed per developer with a one-time payment for indefinite use. Access to updates and technical support is available through a subscription. See our SurveyJS Dashboard licensing page for full details.
Learn more on our SurveyJS Dashboard product page.

SmartClient is a powerful JavaScript component suite compatible with React, Vue, Angular, and more, designed for building large-scale, high-performance web apps. It offers advanced UI components, dynamic data handling, customizable grids, and responsive design. Ideal for enterprise use cases like financial analytics and real-time reporting, SmartClient supports seamless backend integration and delivers optimized performance and scalability.
SmartClient has enhanced hierarchical data handling with the included KeepParentsOnFilter setting, ensuring that parent nodes remain visible in filtered views, even when data is loaded dynamically. It loads "skeleton branches" via a complex client-driven algorithm, automatically managed by SmartClient, to maintain high performance without preloading the entire tree, meaning it doesn't require server-side programming. This is particularly useful in large datasets with load-on-demand trees, as it allows users to maintain full visibility into the structure of filtered results without losing context. By preserving the hierarchical path to matching records, this feature improves usability and clarity in tree-based components, especially in applications where understanding the parent-child relationship is critical.
SmartClient is licensed per developer and is available as both perpetual and subscription licenses. Product updates and technical support is also available. See our SmartClient licensing page for full details.
For more information, visit our SmartClient product page.
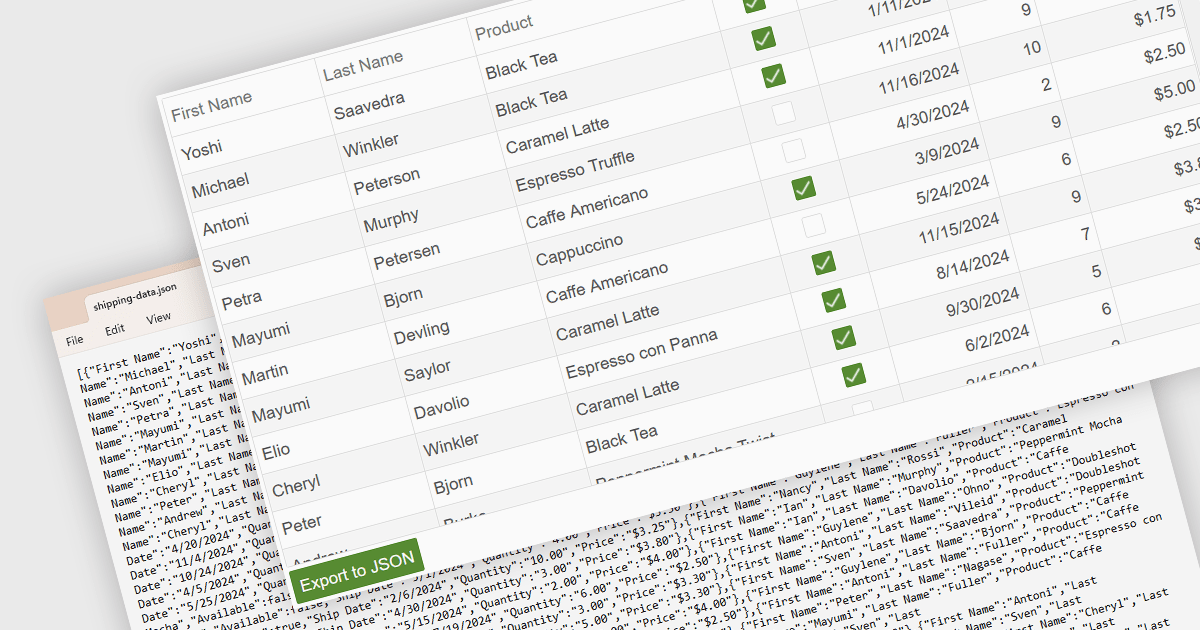
Exporting a data grid to JSON format is a common feature in modern web-based data tools that involves converting the structured data displayed in a grid, such as rows and columns representing records and fields, into JavaScript Object Notation (JSON), a lightweight, text-based format commonly used for data interchange. This process enables the grid's contents to be saved in a machine-readable structure that preserves the hierarchy and attributes of the data, making it easily consumable by web services, APIs, or other applications. The benefits of exporting to JSON include its compatibility with a wide range of programming environments, ease of integration with frontend and backend systems, and suitability for transmitting data across networked systems or persisting it for later use in client-side operations or remote storage.
Several Vue.js grid controls allow you to export to JSON, including:
For an in-depth analysis of features and price, visit our comparison of Vue.js grid controls.





Tel: (888) 850 9911
Fax: +1 770 250 6199


