








Official Supplier
As official and authorized distributors, we supply you with legitimate licenses directly from 200+ software publishers.
See all our Brands.
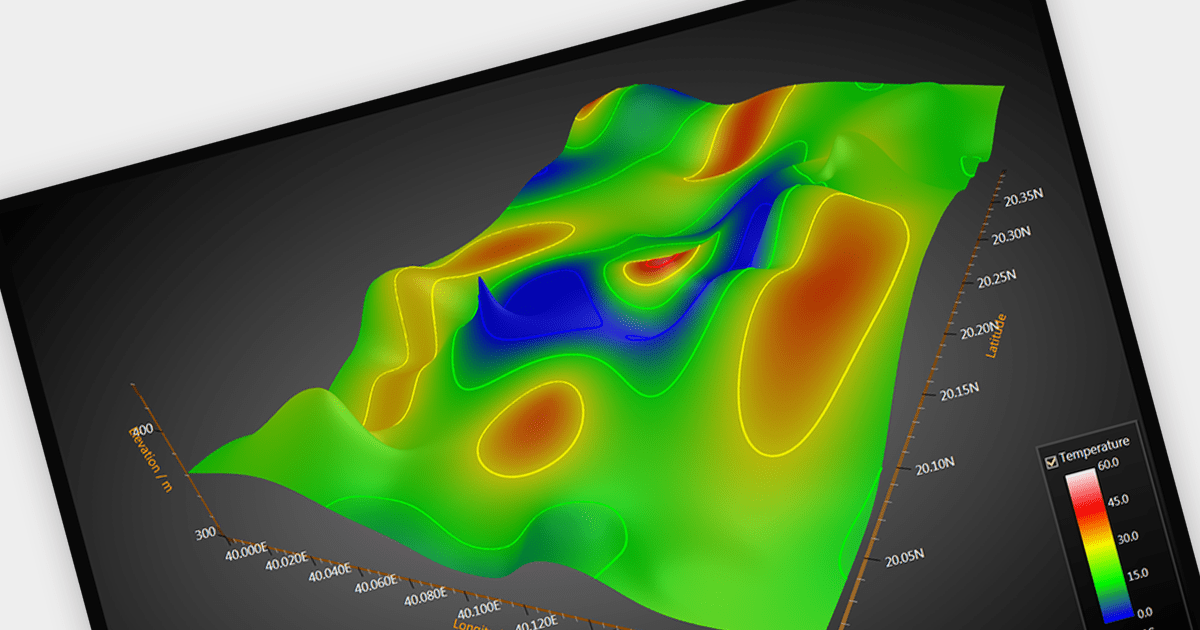
Surface charts are graphical representations that depict three-dimensional data in a two-dimensional format, typically using a grid of rows and columns. These charts provide a visual representation of how two independent variables (typically represented on the X and Y axes) influence a dependent variable, represented by the height or color of the surface. The primary benefit of surface charts lies in their ability to reveal complex relationships within datasets, making it easier for analysts and decision-makers to grasp patterns and trends. Surface charts offer a valuable tool for analyzing data in fields such as scientific research, engineering, finance, and various other domains.
Several WPF chart controls offer Surface charts including:
For an in-depth analysis of features and price, visit our WPF chart controls comparison.
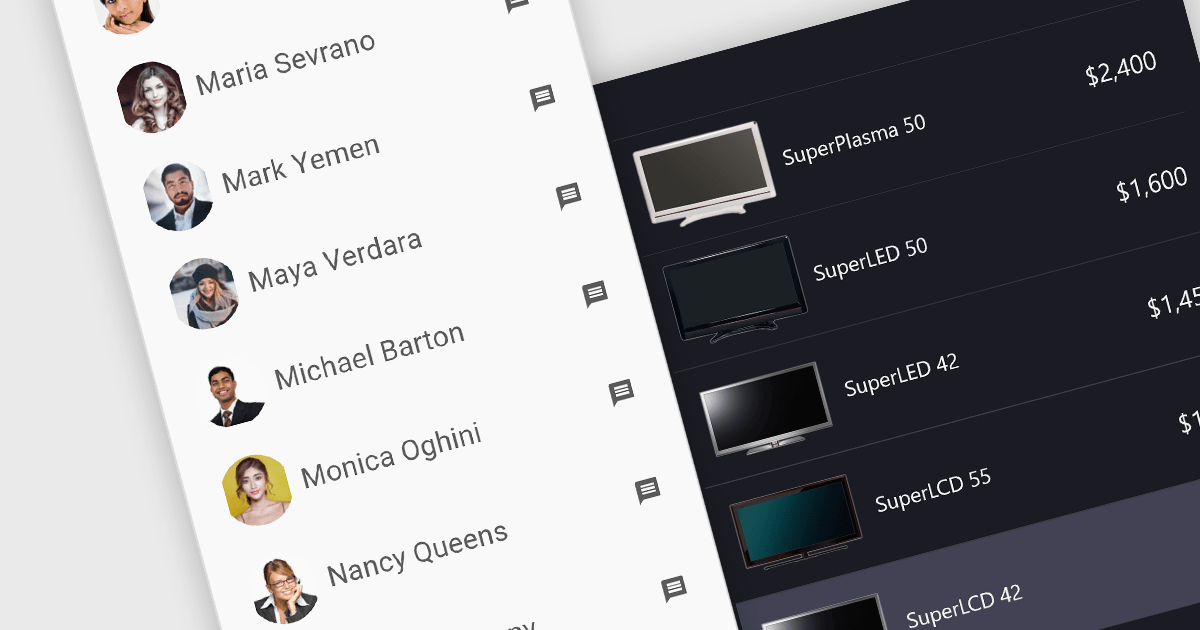
Image listboxes transcend the limitations of traditional listboxes by incorporating image previews alongside textual labels. This creates an intuitive browsing experience, enabling users to quickly identify and select an option with visual cues. This is particularly useful for applications where visual selection enhances the user experience, such as choosing products in an e-commerce platform or selecting avatars in user profiles. It combines the clarity of images with the efficiency of a listbox to streamline selection processes.
Several JavaScript data editor collections provide image listbox capabilities including:
For an in-depth analysis of features and price, visit our comparison of JavaScript Data Editor components.
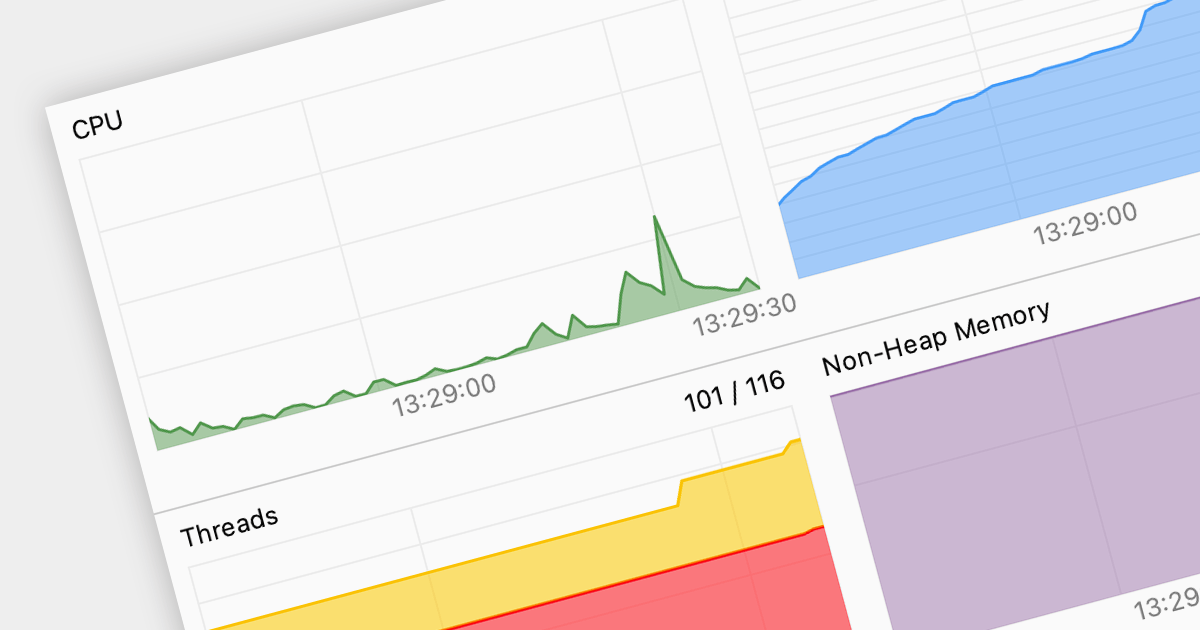
Code profiling is a diagnostic technique employed to analyze the runtime behavior of an application. It dissects resource consumption, usually including CPU time, memory allocation, and function call frequency, to precisely identify performance bottlenecks and resource hogs. Armed with these insights, developers can optimize specific code sections, leading to improved user experience, resource efficiency, and ultimately, a more robust and performant application.
Several IDEs support code profiling, including:
For an in-depth analysis of features and price, visit our IDEs comparison.
Stimulsoft Dashboards is a versatile suite of tools for crafting interactive data visualizations for web and desktop applications. It empowers developers to embed intuitive dashboards across various platforms, including .NET, JavaScript, and PHP, using the platform-specific components or a centralized cloud designer. With rich data analysis elements, extensive customization options, and pre-built templates, Stimulsoft Dashboards helps you transform complex data into clear, actionable insights for any audience.
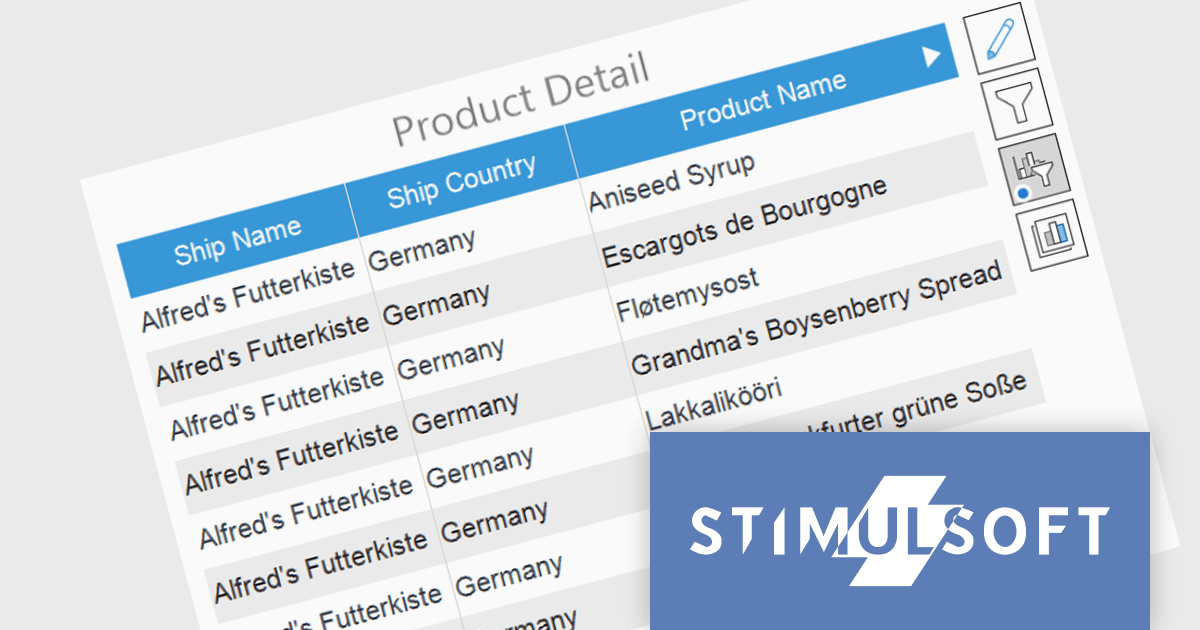
The Stimulsoft Dashboards 2024.1.1 update adds the option to include custom filters for the Table element in dashboards. When filters are applied to the table, a dedicated control element lets you easily edit and remove user filters with a single click. This intuitive addition streamlines workflow, keeps you focused, and ensures your dashboards always reflect the exact insights you need.
To see a full list of what's new in version 2024.1.1, see our release notes.
Stimulsoft Ultimate is licensed per developer and is available as a Perpetual license with 1 year support and maintenance. See our Stimulsoft Ultimate licensing page for full details.
Stimulsoft Dashboards is available to buy in the following products:
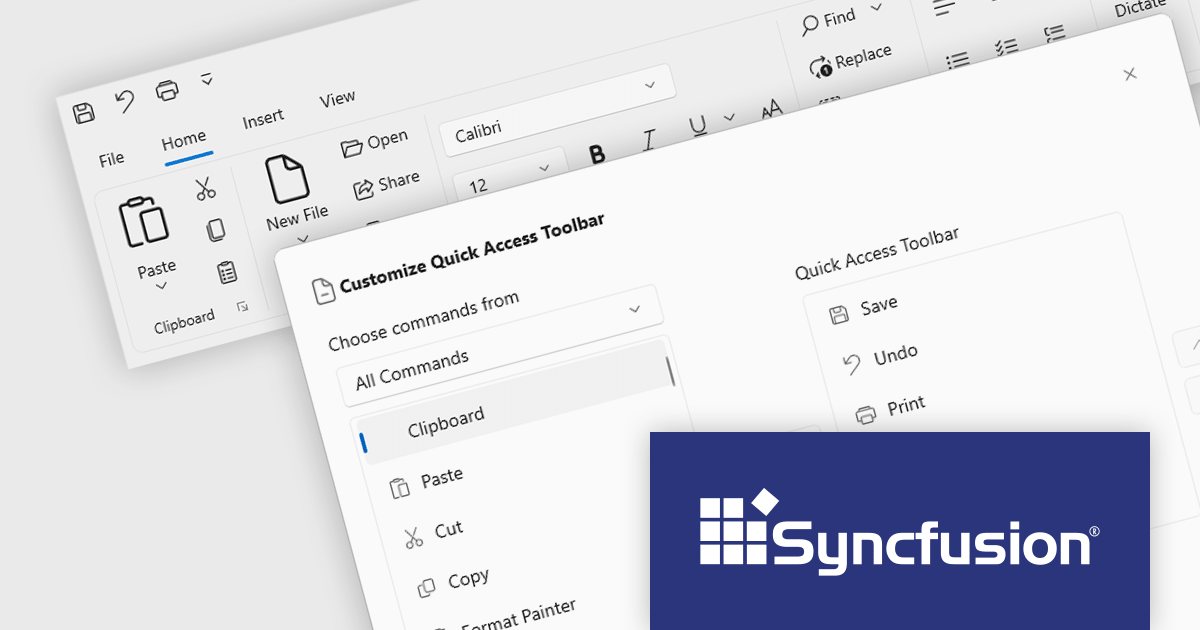
Syncfusion Essential Studio WinUI, available as part of Syncfusion Essential Studio Enterprise, is a comprehensive toolkit for building high performance native Windows desktop applications. It offers tools for crafting modern UI elements like charts, data grids, and ribbon interfaces, alongside powerful editing tools for Word, Excel, and PDF documents.
Version 2023 Volume 4 (24.1.41) adds the ability to for end users to customize the quick access toolbar by adding or removing commands through a dialog window. Adding frequently used commands from across the application grants instant access, reducing navigation fatigue and clicks. Removal of rarely used functions declutters the interface, minimizing distractions and simplifying the user experience. This personalized workspace fosters ownership and engagement, ultimately making users more productive and adept.
To see a full list of what's new in version 2023 Volume 4 (24.1.41), see our release notes.
Syncfusion Essential Studio WinUI is available as part of Syncfusion Essential Studio Enterprise which is licensed per developer starting with a Team License of up to five developers. It is available as a 12 Month Timed Subscription License which includes support and maintenance. See our Syncfusion Essential Studio Enterprise licensing page for full details.
For more information, visit our Syncfusion Essential Studio WinUI product page.





Tel: (888) 850 9911
Fax: +1 770 250 6199


