








Official Supplier
As official and authorized distributors, we supply you with legitimate licenses directly from 200+ software publishers.
See all our Brands.
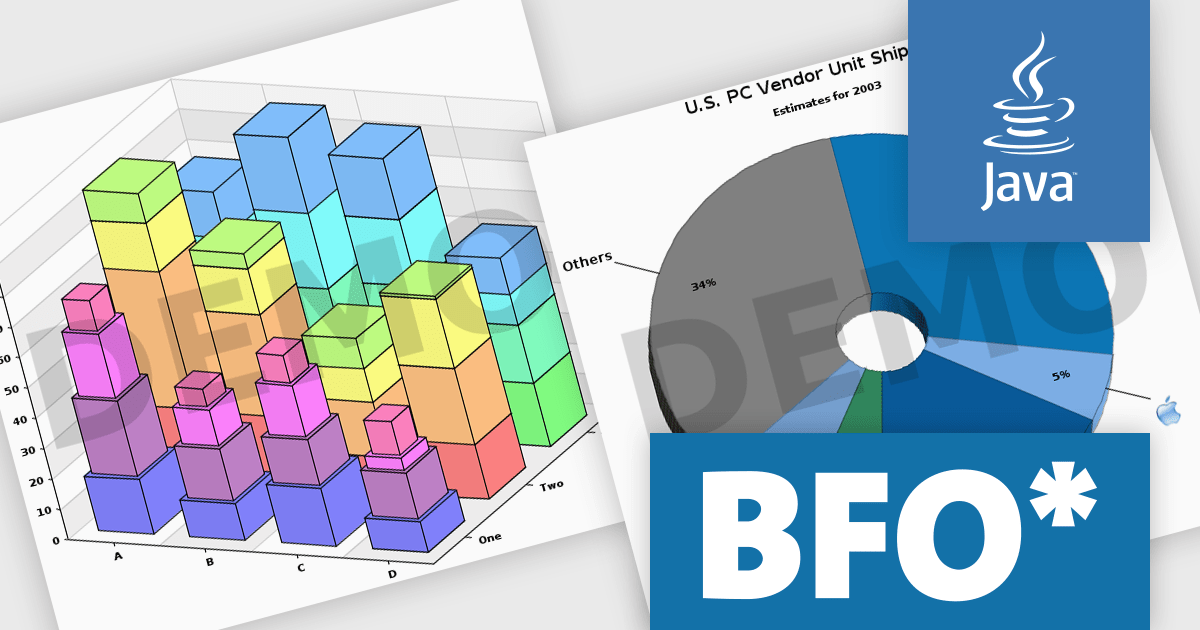
The Big Faceless Graph Library enables the creation of top-tier graphs and charts in Java. Powered by a robust 3D engine, it can generate 2D or shaded 3D pie charts, line graphs, area charts, and bar graphs from any perspective. These visuals can be exported to formats such as PNG, Flash, PDF, or SVG, delivering fast and impressive results.
The full 3D engine with an adjustable light source creates visually stunning and realistic graphs. Dynamic lighting allows users to fine-tune illumination, enhancing depth perception and clarity, making complex data easier to grasp. With control over shadows, highlights, and textures, the feature offers lifelike data representation. Customizable lighting emphasizes key details, making presentations more engaging and professional. Ideal for technical reports, financial visuals, or research, this advanced 3D engine delivers unmatched realism, helping your data stand out.
Big Faceless Graph Library is licensed per server, and is available as a perpetual license. We can supply Internal, External and OEM licenses. See our Big Faceless Graph Library licensing page for full details.
For more information, visit our Big Faceless Graph Library product page.
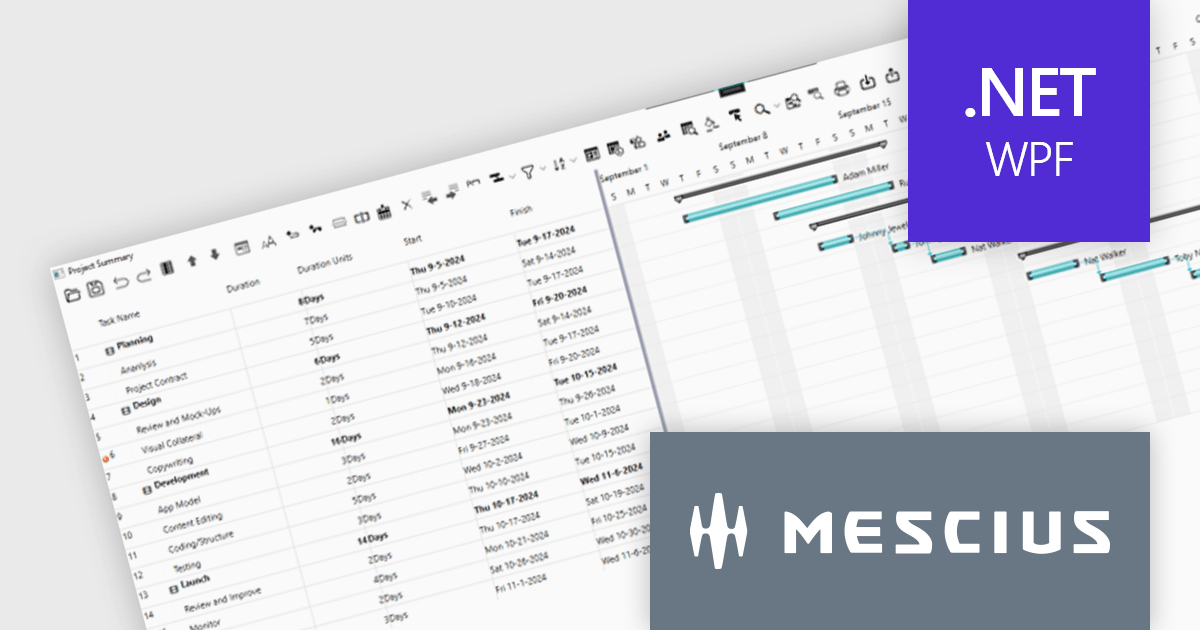
ComponentOne WPF Edition is a comprehensive suite of UI controls designed to accelerate the development of modern, visually appealing WPF applications. Offering a wide range of components, including grids, charts, input controls, and more, it empowers developers to create rich, interactive user interfaces with ease. By leveraging ComponentOne's advanced features and performance optimizations, businesses can deliver exceptional user experiences and gain a competitive edge.
In this blog, MESCIUS Associate Software Engineer Nitin Sharma demonstrates how to use theC1GanttView control included in ComponentOne Studio WPF to provide a clear view of project timelines, task durations, dependencies, and resources. You will learn the steps involved to utilize the WPF Gantt View Control in Visual Studio, including:
Sample source code is included for each step.
Read the complete blog to get started leveraging the power of Gantt Charts in your WPF apps.
ComponentOne Studio WPF is licensed per developer on a perpetual basis and includes a 12 month subscription. See our ComponentOne Studio WPF licensing page for full details.
Learn more on our ComponentOne Studio WPF product page.
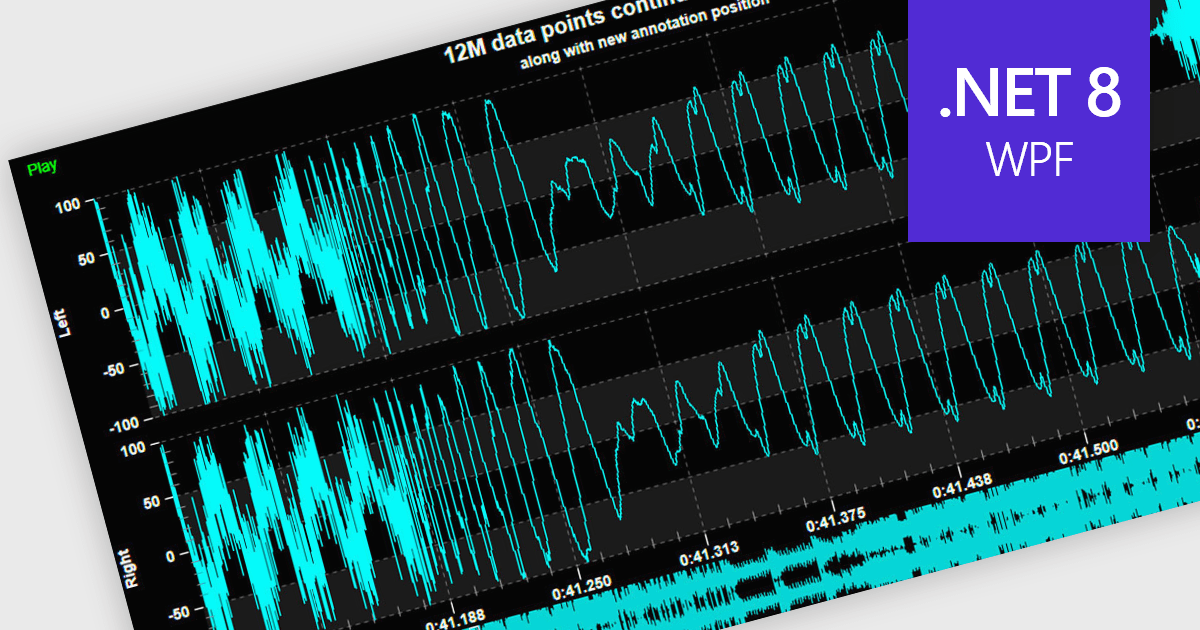
Live data support provides real-time updating of data points on a chart as new information becomes available, without the need for manual refresh or reloading. This feature allows developers to create responsive, interactive applications that can display dynamic data streams, such as financial market data, IoT sensor outputs, or real-time user metrics, directly within a chart interface. Live data enhances the user experience by providing immediate feedback and insight, improving decision-making and performance in applications that require constant data monitoring and analysis.
Several .NET 8 WPF chart controls support live data including:
For an in-depth analysis of features and price, visit our .NET 8 WPF chart controls comparison.
Nevron Chart for SSRS is a robust charting tool for SQL Server Reporting Services, offering a variety of chart types such as bar, line, pie, and advanced options like financial and gauge charts. It enables users to create highly customizable, data-driven visuals integrated with their reports. Key features include multiple axes, customizable legends, and dynamic data grouping. Nevron Chart is ideal for organizations looking to enhance their reports with clear, actionable data visualizations, making it a valuable tool for data analysis and decision-making.
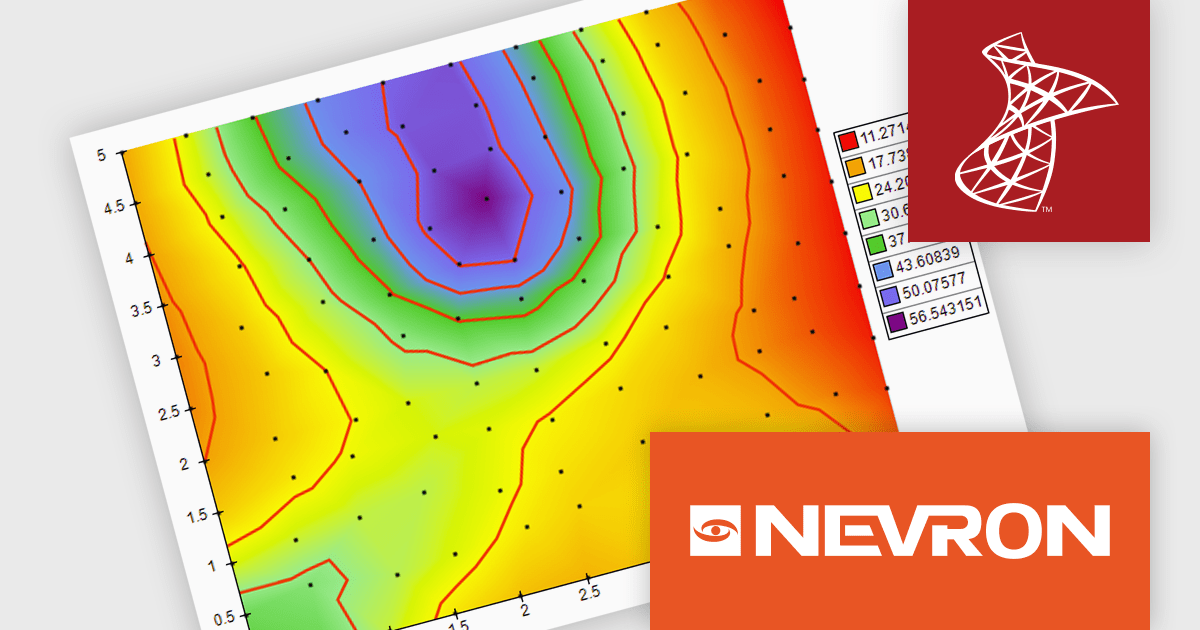
The Nevron Chart for SSRS 2024.1 release adds new Triangulated HeatMap that enables intuitive visualization of complex data by transforming X, Y, and Z coordinates into a smooth, color-interpolated heatmap. It automatically generates a Delaunay triangular network for optimal data representation and adds isolines to highlight equal elevation points, making it ideal for analyzing patterns in multi-dimensional datasets. This feature streamlines complex data analysis, offering faster insights and precise visualizations for informed decision-making.
To see a full list of what's new in 2024.1, see our release notes.
Nevron Chart for SSRS is licensed per developer and is available as a perpetual license with 1 year support and maintenance. See our Nevron Chart for SSRS licensing page for full details.
Nevron Chart for SSRS is available in the following products:
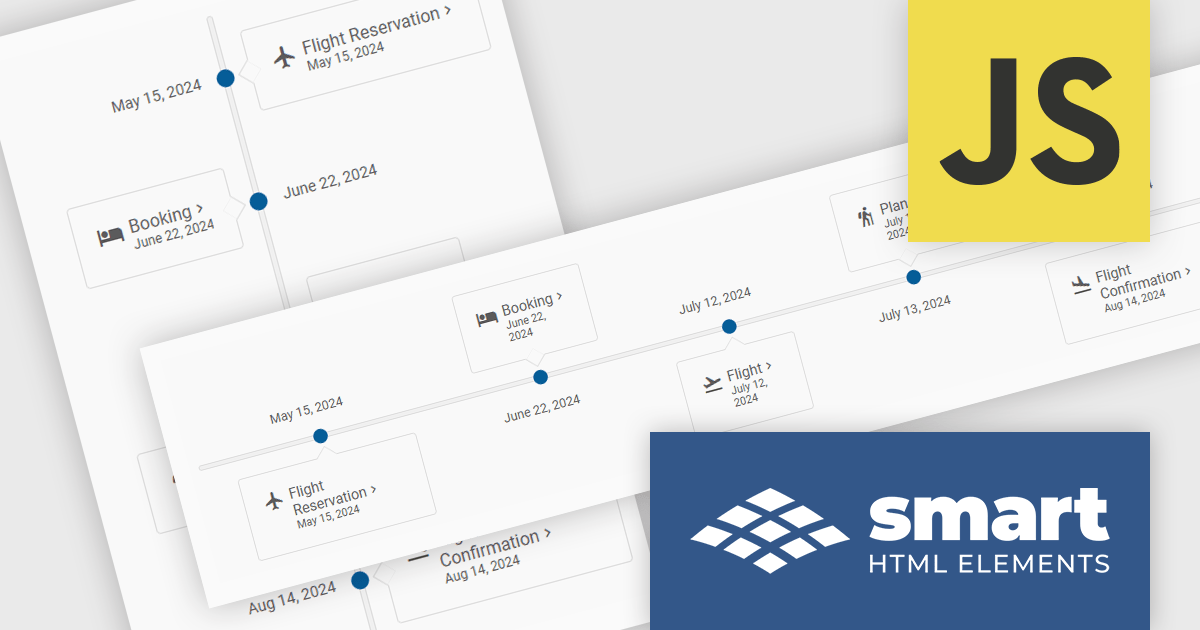
Smart UI (formerly known as Smart HTML Elements) is an enterprise-grade UI library offering pre-built web components for developers in Angular, React, Vue, Blazor, and JavaScript. It boasts over 60 ready-to-use components like grids, charts, schedulers, and editors, all featuring two-way data binding, responsiveness, accessibility, and theming capabilities. This library helps developers rapidly build dynamic and modern web applications with consistent look-and-feel and rich functionalities, accelerating development time and ensuring professional quality.
The Smart UI v20.0.0 release includes a new Timeline component which allows you to show a chronological collection of events. You can render the timeline in vertical or horizontal layouts and it can be customized with CSS, enabling you to style it to match your application's branding.
To see a full list of what's new in v20.0.0, see our release notes.
Smart UI (Smart HTML Elements) is licensed per developer and is available as a perpetual license with 1 year support and maintenance. It includes distribution to unlimited Web applications, SaaS projects, Intranets and Websites. Team, OEM and Enterprise licensing options are also available. See our Smart UI licensing page for full details.
Learn more on our Smart UI product page.





Tel: (888) 850 9911
Fax: +1 770 250 6199


