


Official Supplier
As official and authorized distributors, we supply you with legitimate licenses directly from 200+ software publishers.
See all our Brands.
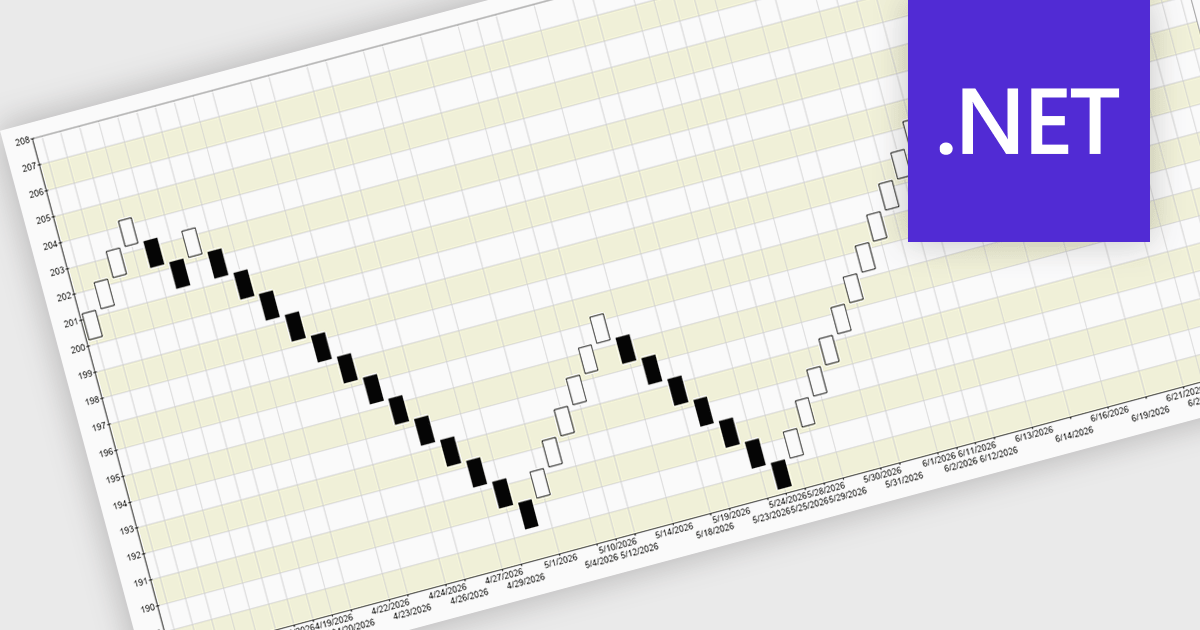
A Renko chart is a type of price chart used in technical analysis that focuses exclusively on price movement rather than time, displaying data as a series of uniform “bricks” that form only when the market moves by a predefined amount. This structure helps filter out minor price fluctuations, making trends and reversals easier to identify while reducing visual noise and improving clarity. As a result, traders can make more informed decisions, confirm trends with greater confidence, and simplify their analysis. Renko charts are commonly used in trend-following strategies, breakout trading, and support and resistance analysis, where a clear view of sustained price direction is more valuable than tracking every small market movement.
Several .NET Chart controls offer a Renko chart including:
For an in-depth analysis of features and price, visit our comparison of .NET Chart controls.
Syncfusion Essential Studio Enterprise provides a comprehensive collection of UI components and frameworks for building modern cross-platform applications. It offers over 1,800 components compatible with .NET WinForms, WPF, ASP.NET Core & MVC, WinUI, MAUI, JavaScript, Blazor, and more, enabling seamless application development across diverse devices and operating systems.
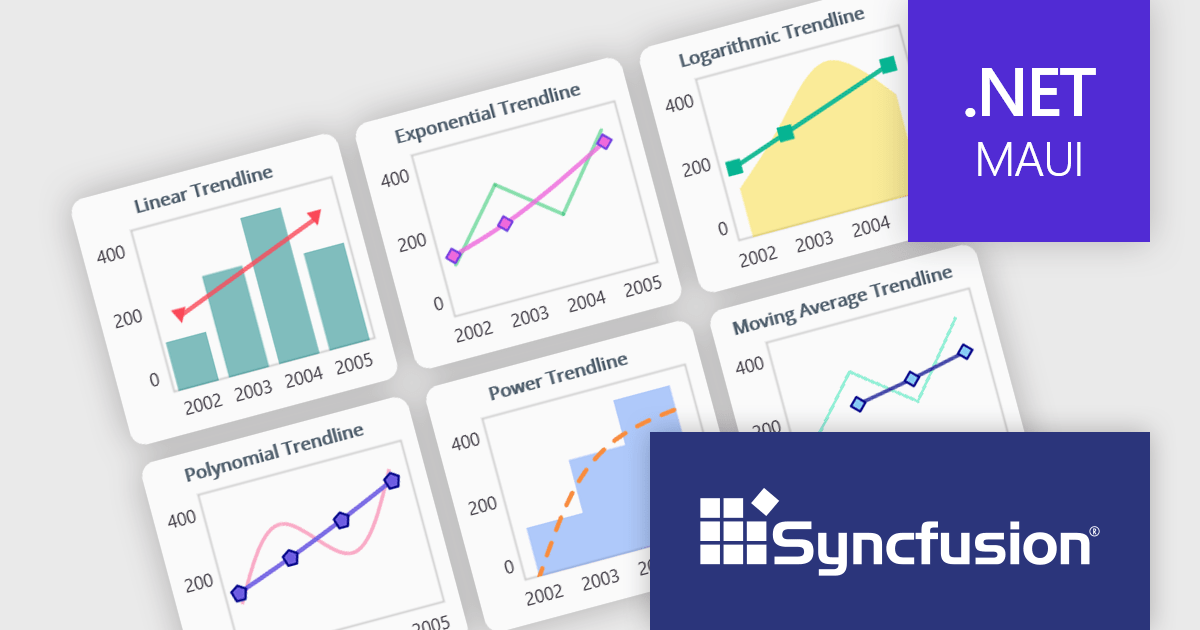
The Syncfusion Essential Studio 2026 Volume 1 update introduces trendline support to its MAUI charts, enabling developers to incorporate analytical context directly into data visualizations by applying linear, exponential, power, and polynomial models to chart series. This functionality allows applications to present clearer data patterns, support basic forecasting, and improve interpretability without requiring additional data processing logic or external tools, helping developers deliver more informative, insight-driven user experiences.
To see a full list of what's new in 2026 Volume 1 (33.1.44), see our release notes.
Syncfusion Essential Studio Enterprise is licensed per developer and is available as a 12 Month Timed Subscription License which includes support and maintenance. See our Syncfusion Essential Studio Enterprise licensing page for full details.
Learn more on our Syncfusion Essential Studio Enterprise product page.
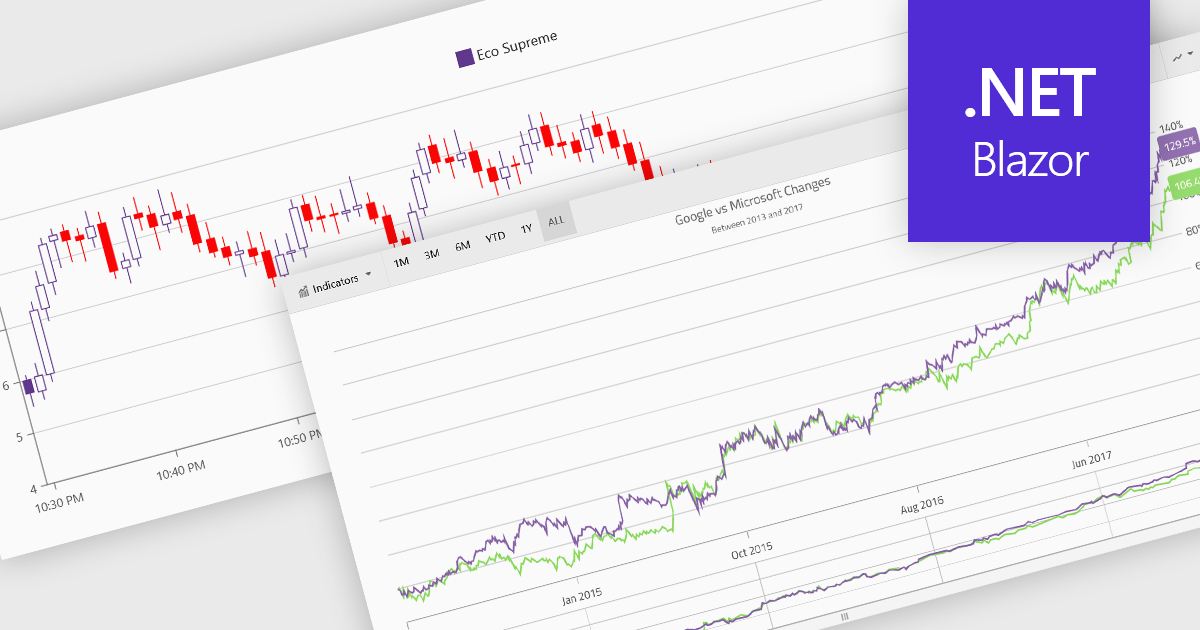
Financial charts are specialized visualizations designed to represent market data and price movements over time. Commonly used in trading platforms and analytical applications, these charts help users interpret open, high, low, and close values, as well as trends and volatility. By providing standardized financial visualizations, charting components enable developers to deliver tools that support technical analysis, decision-making, and real-time data exploration in finance-focused applications.
Common features include:
For an in-depth analysis of features and price, visit our Blazor charts components comparison.
Blazorise is a versatile component library that empowers developers to build modern and feature-rich web applications using Blazor, a client-side web development framework from Microsoft. It offers a comprehensive collection of user interface components, including buttons, forms, charts, and navigation elements, all built with accessibility and responsiveness in mind.
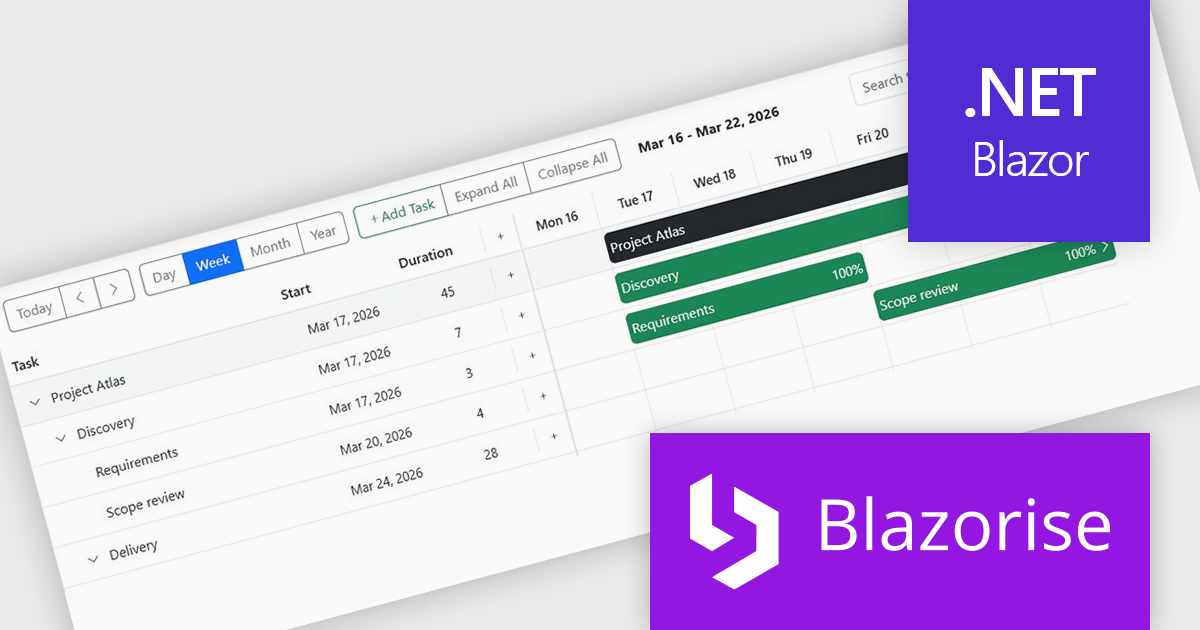
The Blazorise 2.0.3 update introduces a Gantt component that enables developers to implement advanced project planning and timeline visualization directly within their applications, reducing the need for custom development or third party tools while supporting complex scheduling scenarios through features such as task editing, hierarchical data structures, dependency management, filtering, and drag and drop interactions, all within a consistent and theme aligned UI framework.
To see a full list of what’s new in version 2.0.3, see our release notes.
Blazorise is licensed per developer and includes a 1 year subscription for updates and support. Professional, Enterprise, and Enterprise Plus editions are available, each offering tailored levels of support and service to meet varying business needs. See our Blazorise licensing page for full details.
For more information, visit our Blazorise product page.
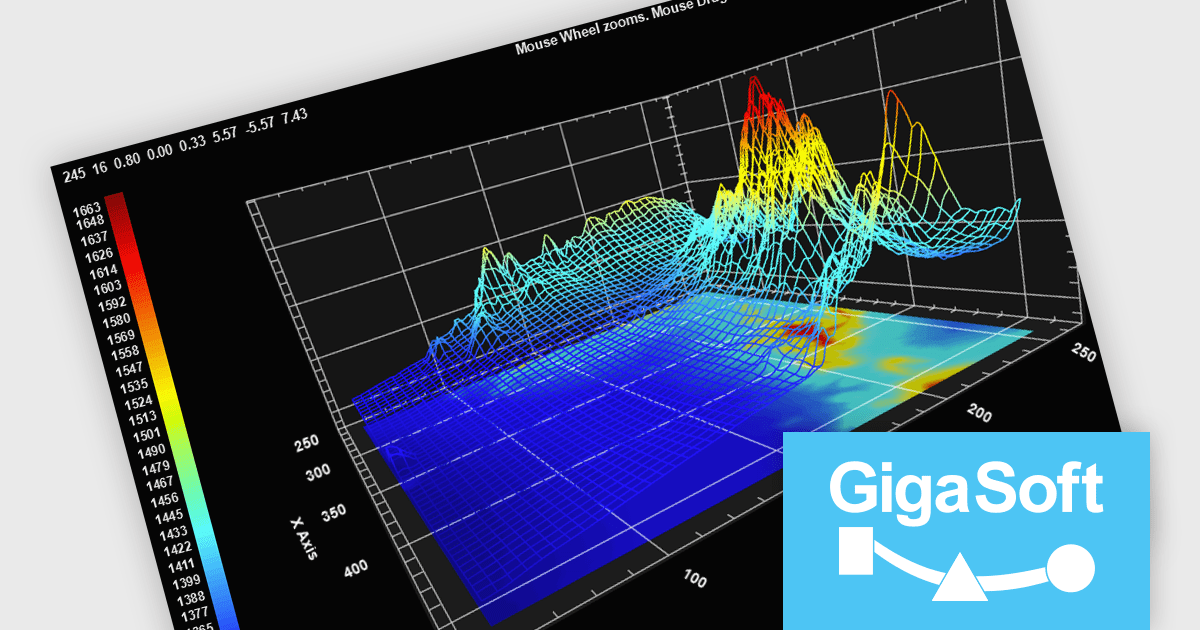
Gigasoft ProEssentials is a robust charting library for Windows development, providing a wide array of 2D and 3D chart types. The product offers a versatile suite of components, such as Graph, Scientific Graph, and 3D Scientific Graph, enabling the creation of sophisticated visualizations. It's extensive support for various platforms and development environments, including WPF, WinForm, and integration with popular IDEs like Visual Studio, enhances flexibility and empowers developers to efficiently visualize data within their applications.
Gigasoft ProEssentials enables developers to work more efficiently with its charting components by giving AI assistants direct, real-time access to validated API data, allowing them to generate accurate chart configurations, suggest correct property usage, and troubleshoot issues based on the actual capabilities of the library. By dynamically querying structured data rather than relying on static documentation, the feature ensures that responses reflect the current state of the API, reducing the likelihood of invalid property paths or unsupported configurations. This leads to more reliable code generation, faster resolution of integration challenges, and greater confidence when implementing or modifying charts within production applications across different environments.
Gigasoft ProEssentials is licensed per developer and is available as a perpetual license with free technical support and maintenance for the life of the version. See our Gigasoft ProEssentials licensing page for full details.
For more information, visit our Gigasoft ProEssentials product page.


Tel: (888) 850 9911
Fax: +1 770 250 6199


