Charts News

Reveal the Relationships Between Multiple Variables

February 2, 2024
Scatter/Bubble charts help you to spot trends, compare magnitudes, and identify clusters across three factors simultaneously.

Scatter and bubble charts are used to display data points on a two-dimensional graph. While scatter charts use dots to represent data points, bubble charts add an additional dimension by varying the dot size, often representing volume or intensity. These charts are useful for showing relationships between variables and for identifying patterns or trends in data.

Several Angular chart controls offer scatter and bubble charts including:

  • Highcharts Core lets you craft interactive surface and bubble charts with detailed customization and dynamic animations.
  • DevExtreme Chart (part of DevExtreme Complete by DevExpress) integrates responsive surface and bubble charts into your Angular applications, providing custom themes.
  • Kendo UI for Angular Chart (part of Kendo UI by Telerik) empowers you to add dynamic surface and bubble charts with advanced data binding to your Angular projects.
  • amCharts 5: Charts visualizes multi-dimensional data in engaging surface and bubble charts, offering rich interactivity and drill-down options.

For an in-depth analysis of features and price, visit our Angular chart controls comparison.

Compare Angular Chart Controls

Build Finance and Trading Apps in JavaScript

February 1, 2024
LightningChart JS Trader is a new JavaScript charting library that offers high-performance, real-time data, and comprehensive technical analysis.

LightningChart JS Trader is a comprehensive charting solution specifically designed for building high-performance financial and trading applications in JavaScript. It equips developers with a rich set of financial charts, over 100 technical indicators for in-depth analysis, and 30+ drawing tools for visual annotations. Additionally, a fully featured datagrid with sparkline support allows for organized data management and display. This combination empowers developers to create interactive and visually engaging trading dashboards, charting tools, and other financial applications with high performance and extensive customization options.

LightningChart JS Trader features include:

  • Advanced Technical Charts: Supports various 2D and 3D chart types like line charts, OHLC bar charts, OHLC candle-stick charts, mountain charts, geo map charts, and more, all customizable for in-depth analysis.
  • Extensive Indicator Library: Over 100 built-in technical indicators like Moving Average Convergence-Divergence (MACD), Bollinger Bands, High Low Bands, and custom indicator creation capabilities.
  • Drawing Tools: 30+ tools for visual annotations, trendlines, Fibonacci retracements, and geometric shapes for clear chart interpretation.
  • Customization: Extensive customization options for charts, indicators, and the entire user interface to match your specific application needs.
  • Performance: Optimized for real-time data handling and smooth rendering, even with complex charts and large datasets.

LightningChart JS Trader is licensed per developer, per application, per year. The annual license includes technical support and product updates for one year. To continue using the software you will need to renew your license each year. There are three editions to choose from; Basic, Plus and Ultimate which offer different levels of functionality and distribution rights. See our LightningChart JS Trader Licensing page for full details.

For more information, visit our LightningChart JS Trader product page.

Visualize the Distribution of a Dataset

January 25, 2024
Incorporate box plots into your Blazor apps to reveal key insights into central tendency, spread, and potential outliers.

Box plots, also known as box-and-whisker plots, are used to display the distribution of a dataset. They show the median, quartiles, and extremes of the data, providing a quick visual summary of the data's central tendency and variability. This makes them particularly useful for statistical analysis and comparing data across categories.

Several Blazor chart controls offer Box plots including:

  • Syncfusion Blazor Chart (part of Syncfusion Essential Studio Enterprise) offers in-depth customization for box plots with quartile ranges, outlier styles, and box appearances.
  • ComponentOne Charts for Blazor (part of ComponentOne Studio Blazor Edition) simplifies box plot creation with notched whiskers and error bars for enhanced data insights.
  • TeeChart Blazor by Steema Software empowers you to visually explore data distribution through flexible box plot configurations and interactive zooming capabilities.
  • NOV Chart for .NET by Nevron delivers advanced box plot functionalities, enabling detailed analysis of data quartiles and outliers for deeper understanding.

For an in-depth analysis of features and price, visit our Blazor chart controls comparison.

Compare Blazor Chart Controls

Unveil Data Insights with Surface Charts

January 22, 2024
Help users understand complex data interactions by adding intuitive 3D visualizations to your WPF applications.

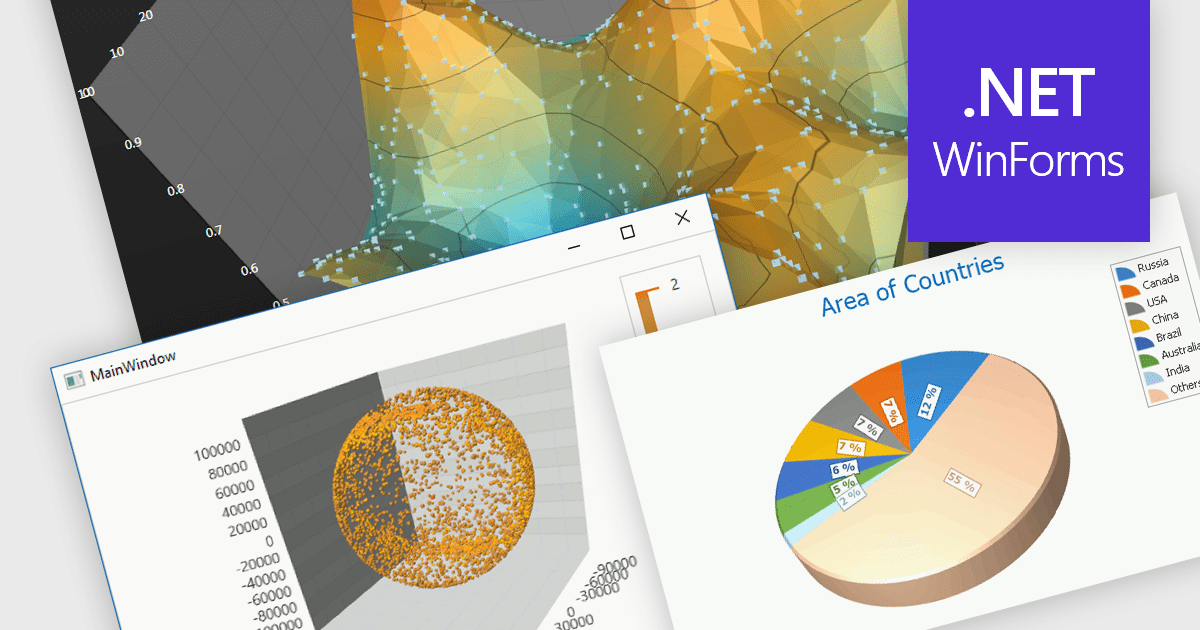
Surface charts are graphical representations that depict three-dimensional data in a two-dimensional format, typically using a grid of rows and columns. These charts provide a visual representation of how two independent variables (typically represented on the X and Y axes) influence a dependent variable, represented by the height or color of the surface. The primary benefit of surface charts lies in their ability to reveal complex relationships within datasets, making it easier for analysts and decision-makers to grasp patterns and trends. Surface charts offer a valuable tool for analyzing data in fields such as scientific research, engineering, finance, and various other domains.

Several WPF chart controls offer Surface charts including:

  • DevExpress WPF Chart (part of DevExpress WPF) allows you to create surface charts with smooth gradients, interactive rotations, and endless customization options.
  • ComponentOne Charts for WPF (part of ComponentOne Studio WPF by MESCIUS) offers interactive 3D surface charts, featuring customizable gradients, rotations, and lighting.
  • LightningChart .NET lets you use surface charts to sculpt data landscapes, uncover hidden patterns, and personalize with interactive rotations, zooms, and customization options.
  • Infragistics WPF Charts (part of Infragistics Ultimate UI for WPF) allows you to transform multidimensional data into visually compelling surface charts.
  • Syncfusion WPF Chart (part of Syncfusion Essential Studio Enterprise) provides you with immersive 3D surface charts, with customizable shading, lighting, and rotations.

For an in-depth analysis of features and price, visit our WPF chart controls comparison.

Compare WPF Chart Controls

Boost Timezone Handling in JavaScript Charts

January 18, 2024
Highcharts v11.3.0 improves support for named timezones and provides UTC fallback for legacy browsers.

Highcharts is a powerful and versatile JavaScript charting library that empowers developers to create interactive and visually appealing data visualizations for web and mobile applications. Renowned for its extensive chart types, from line and bar charts to heatmaps and gauges, Highcharts boasts advanced customization options, allowing you to tailor layouts, colors, and behaviors to seamlessly integrate with your project's aesthetic and functionality.

The Highcharts v11.3.0 release delivers enhanced datetime support with native handling of the time.timezone option. This streamlined approach leverages the browser's built-in time zone capabilities, ensuring compatibility and accuracy. For browsers that don't recognize a timezone, Highcharts provides a clear warning and defaults to the UTC. By eliminating the dependency on moment.js, Highcharts reduces library weight and improves overall project performance.

To see a full list of what’s new in version 11.3.0, see our release notes.

Highcharts is licensed per developer as an Annual or Perpetual License with Internal, Saas, SaaS+ and OEM distribution options. The annual license includes support and all product updates for 1 year and must be renewed to continue to use the software. The perpetual license includes an "Advantage Subscription" for 1 to 5 years which provides support and updates for that period. If you do not renew Advantage then you may continue to use the software at the last release available during the active Advantage period. See our Highcharts Core licensing page for full details.

Highcharts Core is available as part of the following products: