








Official Supplier
As official and authorized distributors, we supply you with legitimate licenses directly from 200+ software publishers.
See all our Brands.

Syncfusion Essential Studio Flutter, available as part of Syncfusion Essential Studio Enterprise, is a powerful UI toolkit that enables you to build beautiful and performant mobile apps for Android and iOS using Flutter. It provides a rich suite of pre-built widgets for common design elements like charts, data grids, calendars, and PDF viewers. These widgets are highly customizable and allow you to quickly implement stunning visuals and advanced functionalities without spending time on repetitive coding.
The Syncfusion Essential Studio Flutter 2024 Volume 2 (26.1.35) release adds new Rate of Change (ROC) and Weighted Moving Average (WMA) technical indicators to the Cartesian Chart component, expanding the available toolkit for financial analysts and traders. These indicators provide valuable insights into market momentum and trends, allowing users to make more informed investment decisions and craft more effective trading strategies.
To see a full list of what's new in 2024 Volume 2 (26.1.35), see our release notes.
Syncfusion Essential Studio Flutter is available as part of Syncfusion Essential Studio Enterprise which is licensed per developer starting with a Team License of up to five developers. It is available as a 12 Month Timed Subscription License which includes support and maintenance. See our Syncfusion Essential Studio Enterprise licensing page for full details.
Learn more on our Syncfusion Essential Studio Flutter product page.
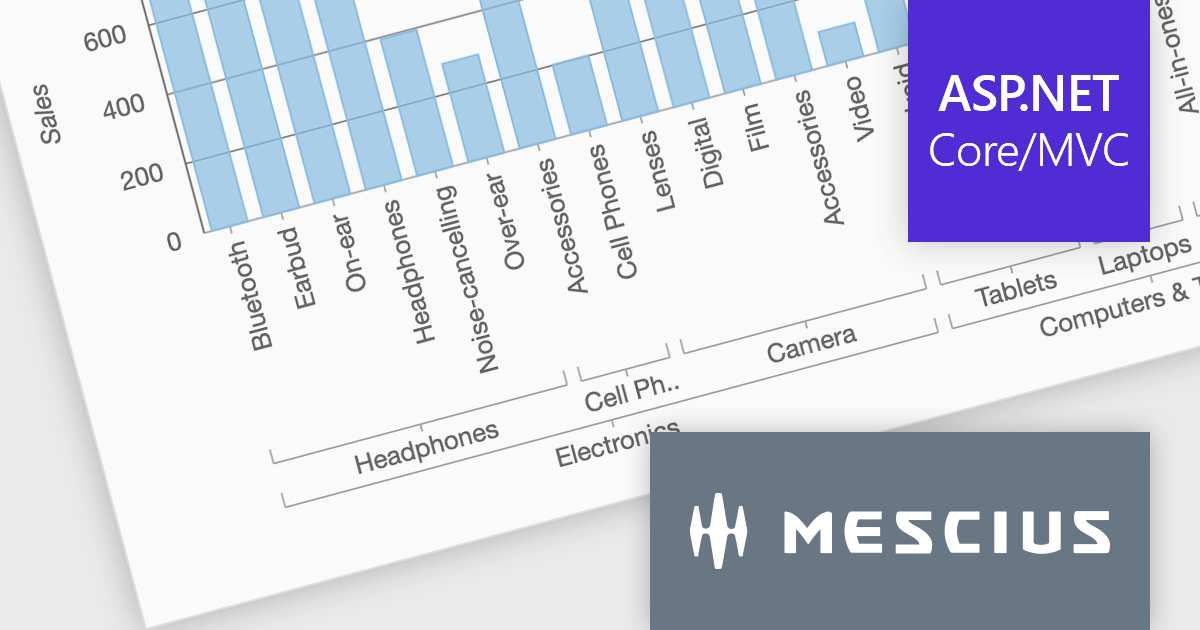
ComponentOne Studio ASP.NET MVC by MESCIUS offers a suite of UI controls designed to expedite development in ASP.NET MVC web applications. These fast, mobile-friendly controls encompass data management like grids, data visualization with charts, and layout components. This empowers you to create feature-rich dashboards and user interfaces. ComponentOne Studio ASP.NET MVC boasts professional design, deep customization options, and project templates to accelerate development, making it a valuable asset for crafting modern, responsive web applications.
The ComponentOne Studio ASP.NET MVC 2024 v1 update introduces axis grouping for FlexChart, enhancing data analysis and visualization. This new feature leverages the grouping capabilities within your data source to automatically group axis labels where possible. This reduces chart clutter, improves readability, and empowers developers to present complex datasets with clear hierarchies, allowing for a more efficient user experience.
To see a full list of what's new in 2024 v1, see our release notes.
ComponentOne Studio ASP.NET MVC is licensed per developer on a perpetual basis and includes a 12 month subscription. See our ComponentOne Studio ASP.NET MVC licensing page for full details.
Learn more on our ComponentOne Studio ASP.NET MVC product page.
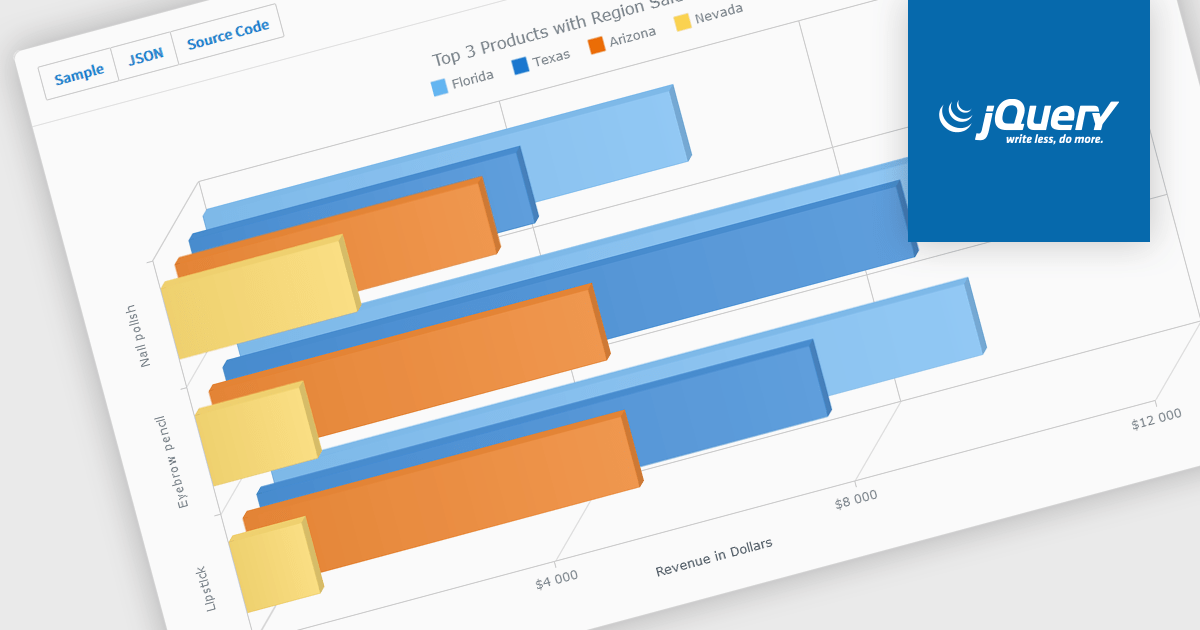
A selection of jQuery chart controls offer 3D capabilities, allowing data visualization to extend beyond the flat plane. This enables a more immersive and engaging user experience, particularly for complex datasets. Three-dimensional charts can be beneficial for highlighting patterns and relationships between multiple variables, making them ideal for scientific visualizations, financial data representation, or showcasing product features in a unique way.
Several jQuery chart controls offer 3D charts including:
For an in-depth analysis of features and price, visit our comparison of jQuery chart controls.

LightningChart .NET is a high-performance data visualization library designed for .NET developers working with WPF, WinForms, and UWP applications. It offers GPU-accelerated rendering for smooth real-time visualization of massive datasets, exceeding billions of data points. This library supports a wide variety of chart types, including 2D, 3D, polar, and geographic maps, along with extensive customization options for each. LightningChart .NET is a powerful tool for developers creating demanding data visualization applications requiring exceptional performance.
The LightningChart v12 update introduces the Polar Heatmap / IntensityGrid series (IntensityGridSeriesPolar), specifically designed for visualizing complex polar data with intensity values. Polar Heatmap charts utilizes a circular coordinate system to visualize data. One axis represents angles (thetas) while the other, known as amplitude, represents the distance from a central point (radii). Color intensity encodes the data values, effectively creating a circular heatmap that reveals both directional trends (angles) and variations in magnitude (amplitude) within the data. This chart type excels at analyzing cyclical or angular data, making it ideal for applications like wind speed and direction or seasonal variations throughout the year.
To see a full list of what's new in v12.0, see our release notes.
LightningChart .NET is available per developer in packages for either WPF, WinForms, UWP or all 3. Each package comes as a subscription license (with 1 or 2 years of limited support), or a perpetual license (with 1 or 2 years of Standard or Premium support). Floating licenses and site licenses are available upon request. See our LightningChart .NET licensing page for full details.
Learn more on our LightningChart .NET product page.
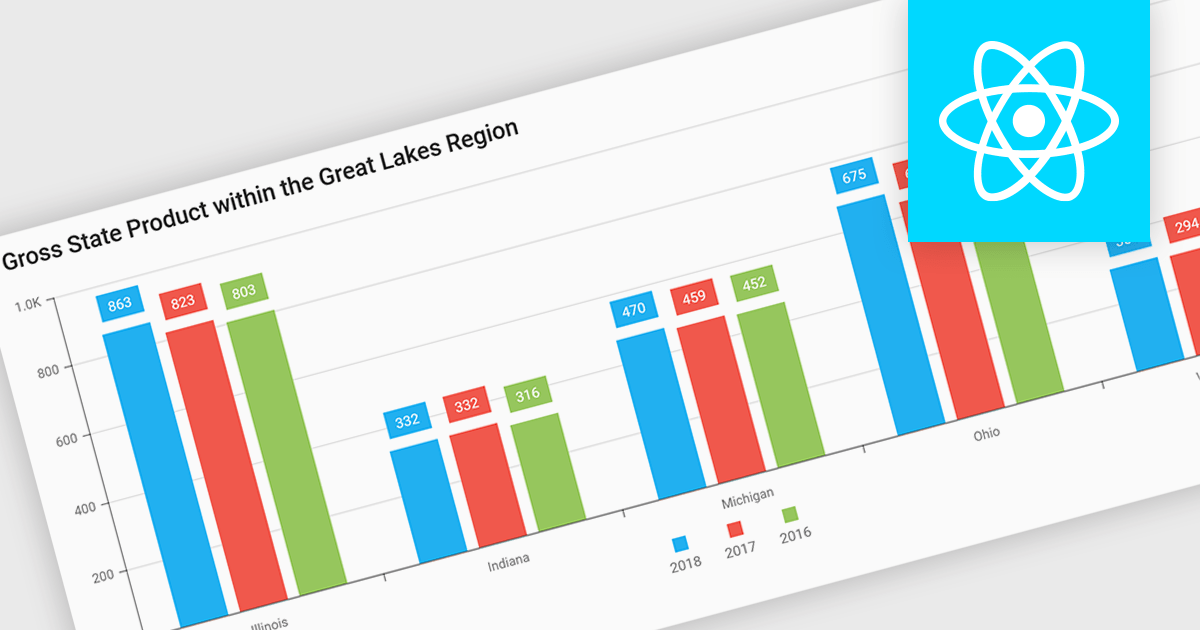
Bar and column charts, though sometimes referred to interchangeably, are vital tools for visualizing data within software applications. Their simple format, with bars representing categories and their lengths proportional to corresponding values, allows users to quickly grasp comparisons between different data sets. This makes them ideal for dashboards displaying sales figures across regions, project management tools tracking task completion rates, or any scenario where users need to compare metrics at a glance. Their effectiveness lies in their ability to present complex information in a clear and concise manner, facilitating informed decision-making within software applications.
Several React Chart controls offer column and bar charts including:
For an in-depth analysis of features and price, visit our React Chart controls comparison.





Tel: (888) 850 9911
Fax: +1 770 250 6199


