


Official Supplier
As official and authorized distributors, we supply you with legitimate licenses directly from 200+ software publishers.
See all our Brands.
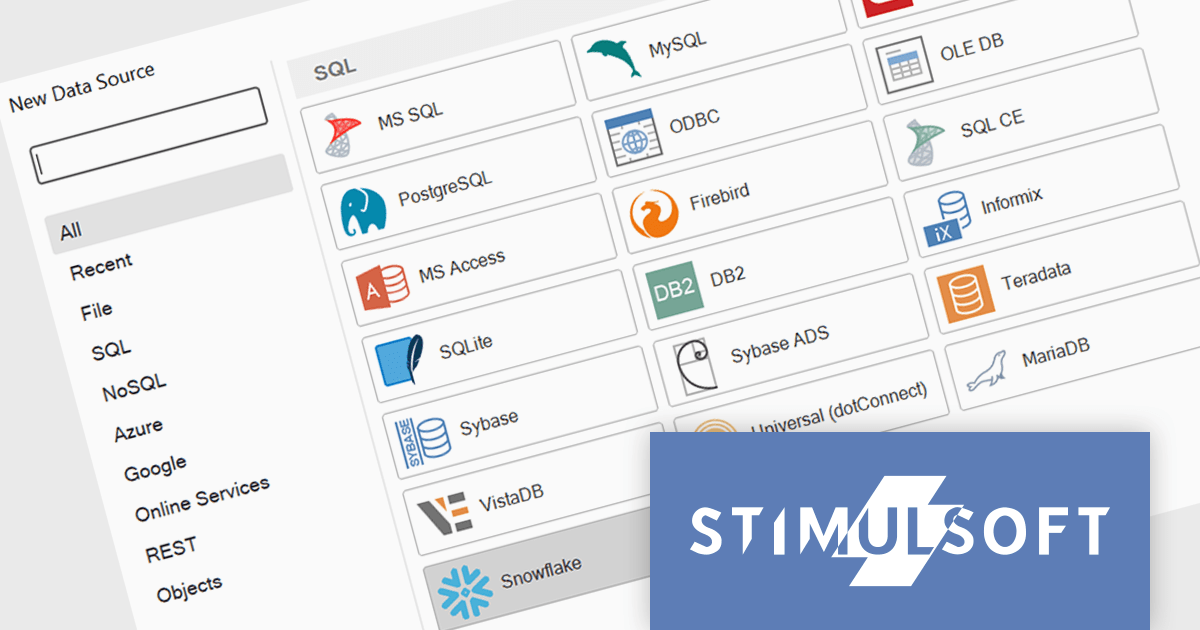
Stimulsoft Reports is a versatile reporting tool that lets you create and generate reports of any complexity from scratch, whether for desktop, web, or mobile platforms. It provides a visual designer and royalty-free runtime that integrates seamlessly with various frameworks like ASP.NET, Java, and JavaScript, empowering applications to generate insightful reports with rich features and diverse export options.
The 2024.1.1 release of Stimulsoft Reports adds a new data adapter for Snowflake, a widely used cloud data storage services, adept at handling both semi-structured and structured data. Developers can now utilize Stimulsoft's robust reporting capabilities to analyze Snowflake data directly, eliminating the need for manual data extraction or intermediary tools. This translates to faster report generation, improved data accuracy, and seamless integration with Snowflake's powerful cloud storage and performance.
To see a full list of what's new in version 2024.1.1, see our release notes.
Stimulsoft Ultimate is licensed per developer and is available as a Perpetual license with 1 year support and maintenance. See our Stimulsoft Ultimate licensing page for full details.
Stimulsoft Reports is available to buy in the following products:
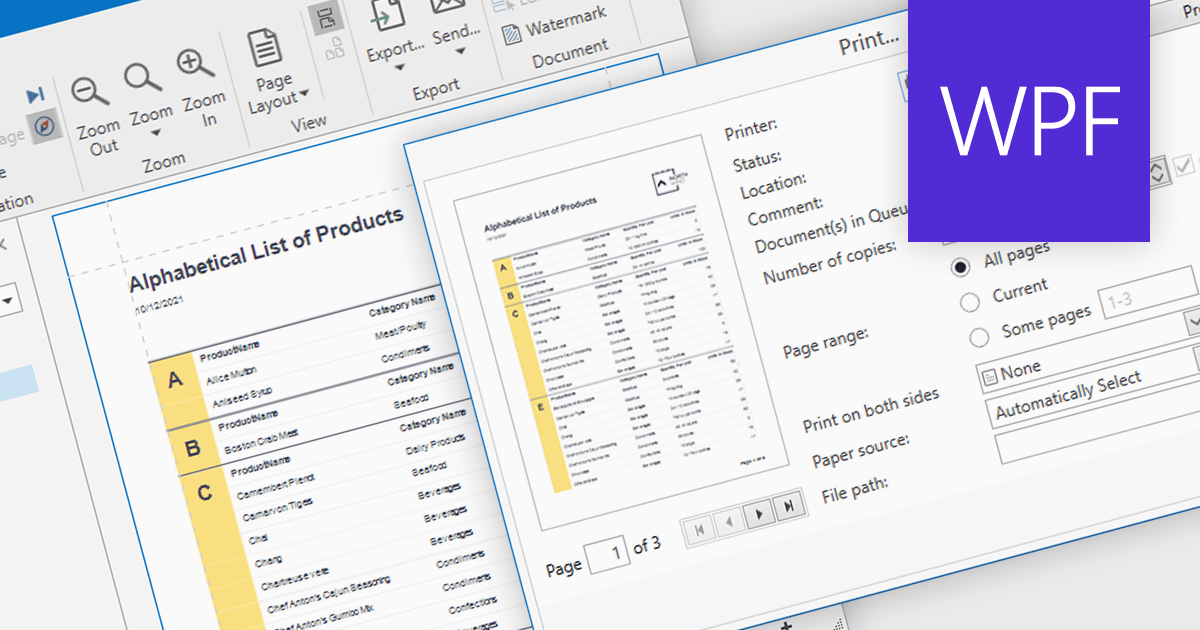
Turning data into tangible insights is critical for businesses, and reporting tools can bridge the gap with robust printing capabilities. These tools support various paper sizes, orientations, and quality settings, ensuring accurate and professional representation of reports in physical form. Additional features like printer selection and print preview streamline the process, further enhancing efficiency.
Several WPF reporting components support printing including:
For an in-depth analysis of features and price, visit our WPF reporting comparison.
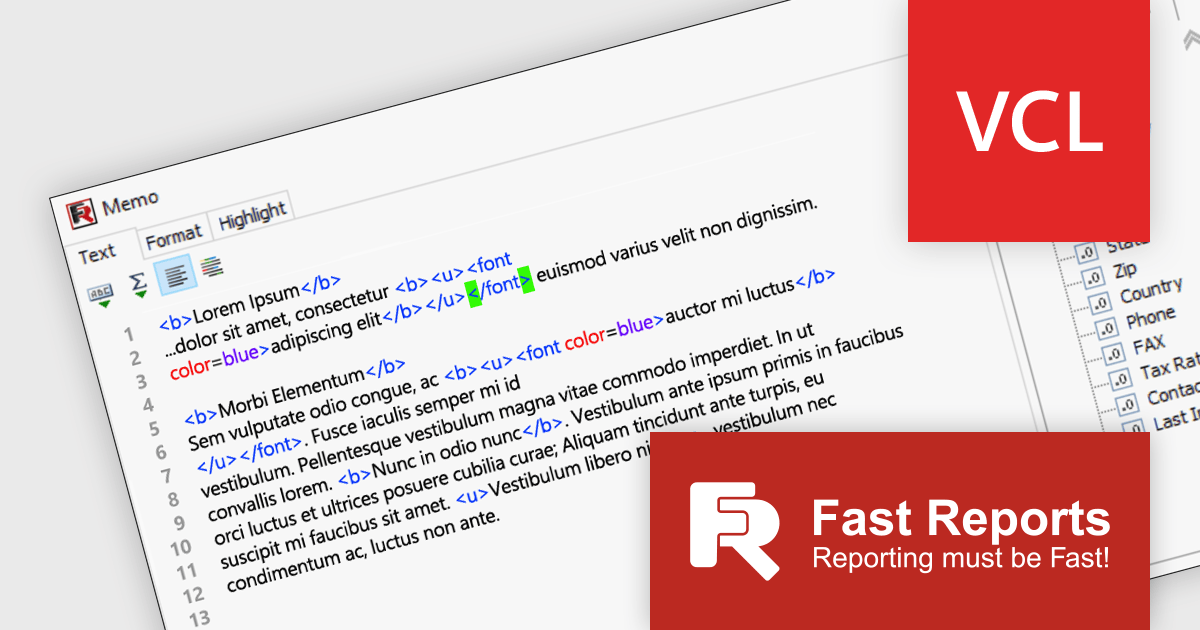
FastReport VCL is a VCL library for creating documents and reports in Embarcadero Delphi, C++Builder, RAD Studio, and Lazarus. It is an add-on component that includes all of the tools needed to create reports, such as a visual report designer, a reporting core, and a preview window, allowing you to add functionality to your application for quick and efficient report generation.
FastReport VCL v2024.1 significantly enhances report design with its focus on streamlined expression editing* and data handling. The revamped report designer features a new "Text" object editor that elevates the editing experience by highlighting expression elements and tags within regular text. It also boasts interactive bracket highlighting and word wrap for added convenience. The redesigned Data Field editor empowers precise field definition through its new mode for modifying the field list. This mode allows for customized field handling, without requiring a connection to a large database.
To see a full list of what's new in 2024.1, see our release notes.
FastReport VCL is licensed per named user and is available as a Perpetual license with 1 year of technical support and product updates. See our FastReport VCL licensing page for full details.
For more information, see our FastReport VCL product page.
*Only available in the Enterprise and Ultimate Editions.
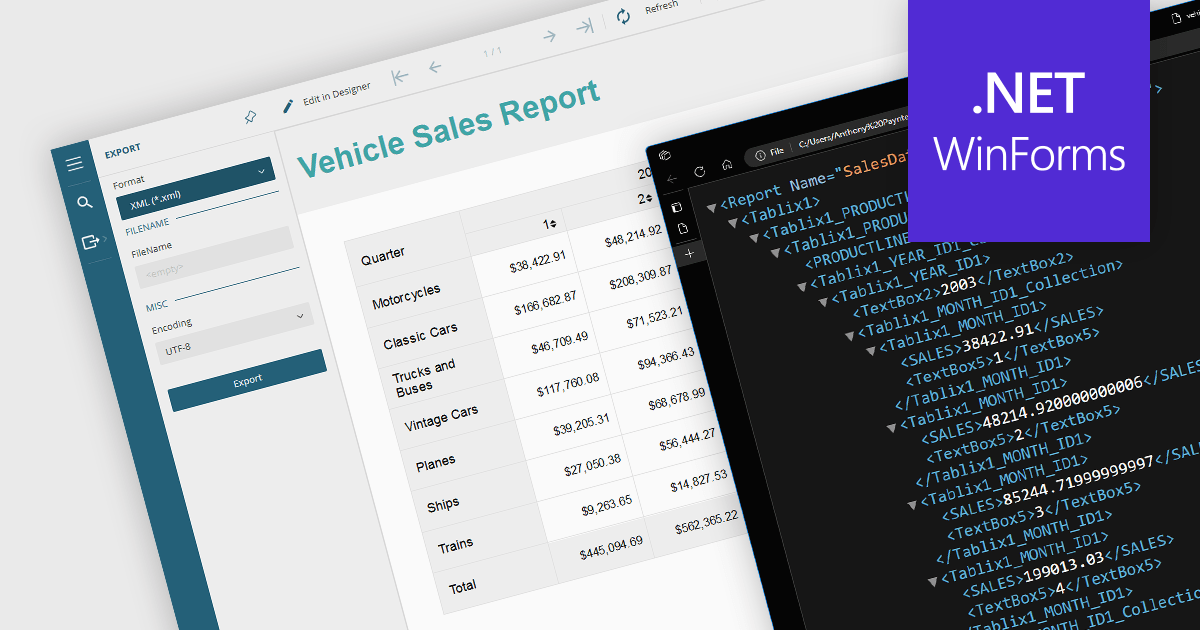
Exporting reports to XML offers several benefits. Firstly, its structured format makes it easy to share and integrate with various applications and platforms regardless of their operating system or software. This flexibility fosters seamless data exchange and analysis across different systems. Secondly, XML's clear tags and hierarchy simplify data manipulation and transformation, allowing for easier filtering, sorting, and restructuring of report data. Additionally, XML's compact nature often translates to smaller file sizes, making it efficient for storage and transmission. Overall, XML export empowers users with greater flexibility, interoperability, and data manipulation compared to traditional formats, unlocking valuable insights from their reports.
Several .NET WinForms reporting controls offer XML export including:
For an in-depth analysis of features and price, visit our .NET WinForms reporting comparison.
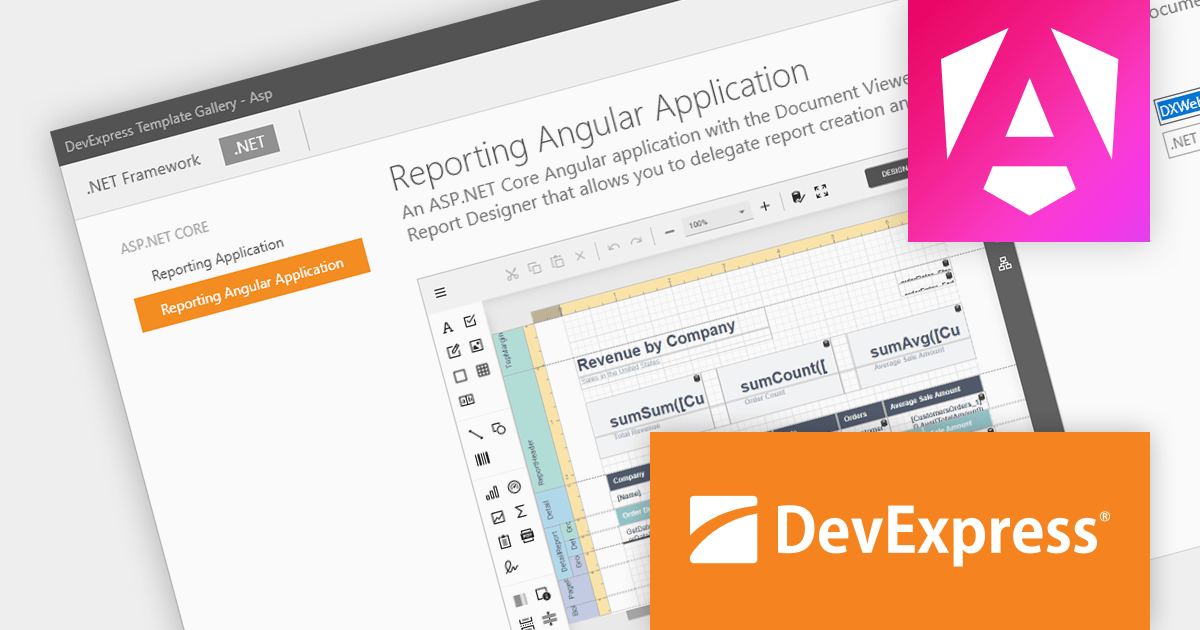
DevExpress Reporting is a powerful, versatile tool for building reports in the .NET ecosystem. It lets you design professional-looking reports with a visual editor, connect to various data sources, and customize them with charts, graphs, and interactive elements. Whether you're creating invoices, sales summaries, or complex dashboards, DevExpress Reporting offers the flexibility and features to bring your data to life in a clear and insightful way. It integrates seamlessly with WinForms, WPF, Web, and Blazor applications, making it a popular choice for developers who need a robust reporting solution.
The DevExpress Reporting 23.2 release introduces a native Angular Report Viewer. This new component seamlessly integrates into your Angular applications, eliminating the need for Knockout.js. Built for performance, it leverages native platform rendering for lightning-fast document visualization. Property management is simplified, replacing observable complexities with a straightforward event-based mechanism. To optimize development, you can now utilize native Angular components as templates for report viewer elements. Embrace a streamlined, efficient, and Knockout-free reporting experience with the Native Angular Report Viewer.
To see a full list of what's new in version 23.2, see our release notes.
DevExpress Reporting is licensed per developer and is available as a Perpetual License with a 12 month support and maintenance subscription. See our DevExpress Reporting licensing page for full details.
DevExpress Reporting is available to buy in the following products:


Tel: (888) 850 9911
Fax: +1 770 250 6199


