


Official Supplier
As official and authorized distributors, we supply you with legitimate licenses directly from 200+ software publishers.
See all our Brands.
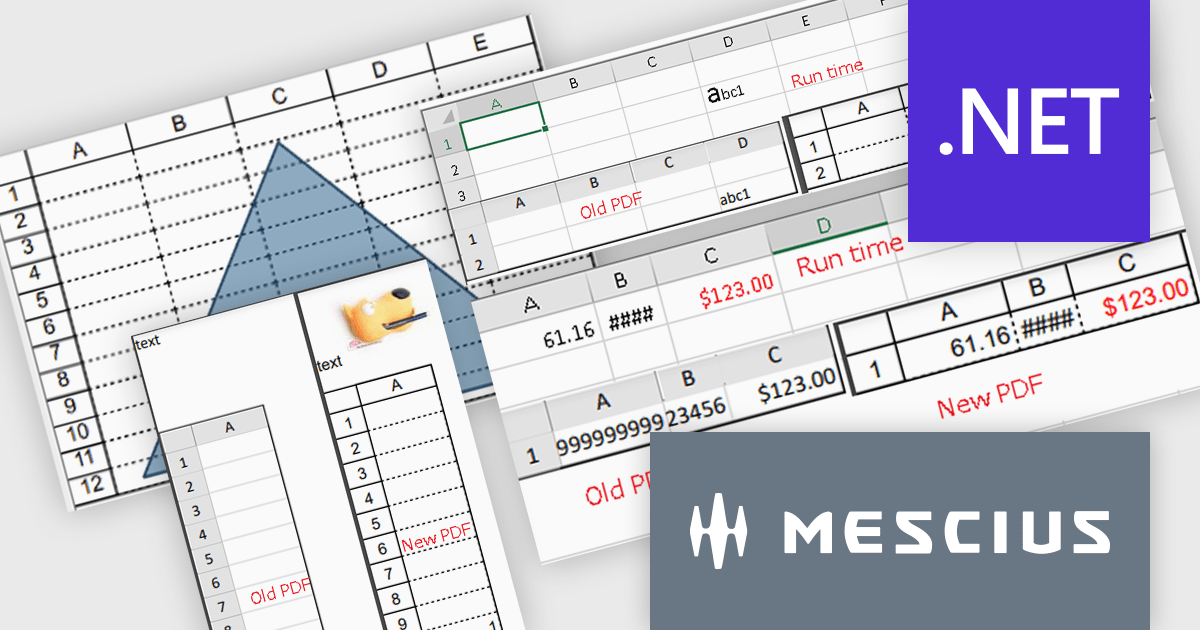
Spread.NET by MESCIUS is a versatile spreadsheet component for .NET applications, enabling developers to integrate Excel-compatible functionalities into Windows Forms, WPF and ASP.NET. With features like advanced data visualization, pivot tables, conditional formatting, and customizable formulas, Spread.NET handles large data sets efficiently and allows seamless Excel import/export. This tool is ideal for applications needing robust data analytics and reporting, such as financial software and business intelligence solutions, enhancing user experience with a familiar spreadsheet interface.
The Spread.NET 18 update enhances PDF export capabilities by delivering high-resolution outputs with improved image quality and rendering precision. This update aligns closely with Excel-compatible printing features, ensuring accurate representation of rich text, flat style modes, transparent shapes and header/footer images in PDF documents. Developers can now save individual sheets, entire workbooks or directly print to PDF, providing greater flexibility and efficiency. With these improvements, the PDF export functionality meets professional-grade standards, making it a reliable tool for creating polished, high-quality outputs directly from .NET spreadsheets.
To see a full list of what's new in version 18, see our release notes.
Spread.NET is licensed per developer and is available as a Perpetual License with a 12 month support and maintenance subscription. We can supply any Spread.NET license including new licenses, maintenance renewals, and upgrade licenses. See our Spread.NET licensing page for full details.
For more information, visit our Spread.NET product page.
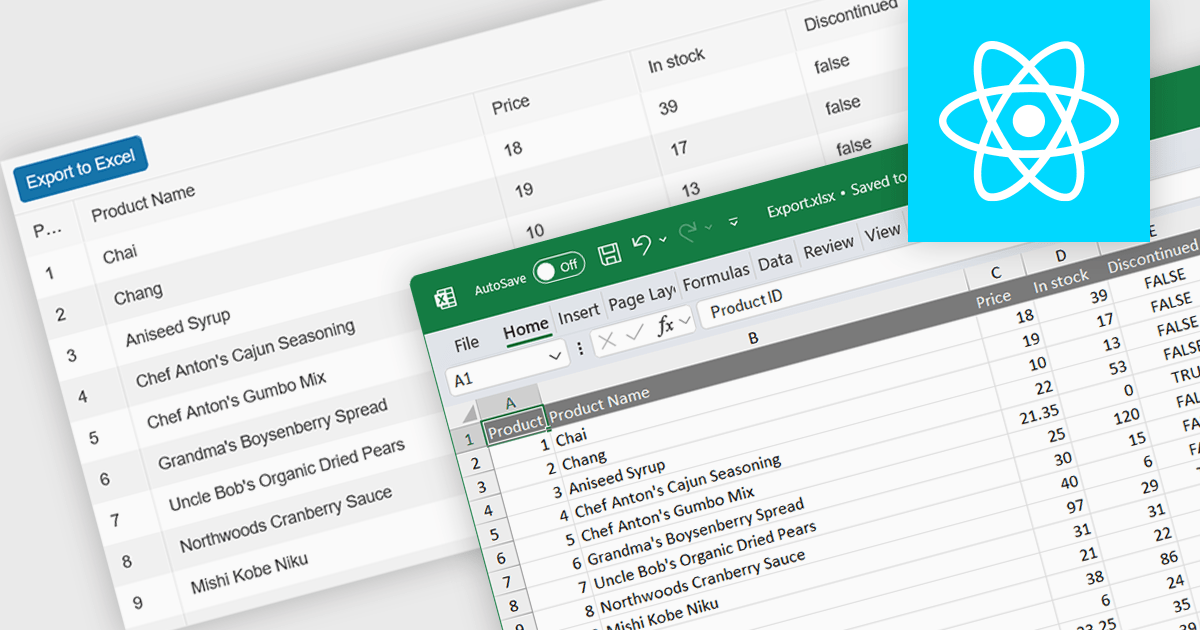
Spreadsheet component with XLSX export functionality allow users to output spreadsheet data into the industry standard Excel-compatible format. This feature is especially useful for applications where data needs to be analyzed, shared, or integrated into external workflows. By enabling XLSX export, users can download structured data directly from the web application in a format widely supported across platforms and software. The benefits of this functionality include maintaining data accuracy, preserving formatting, and supporting large datasets with advanced features like formulas, filters, and charts. Use cases for XLSX export range from financial dashboards and inventory management systems to data analytics platforms and collaborative tools, offering users the flexibility to work offline or share data in a familiar format.
Several React spreadsheet components offer XLSX export, including:
For an in-depth analysis of features and price, visit our React spreadsheet controls comparison.
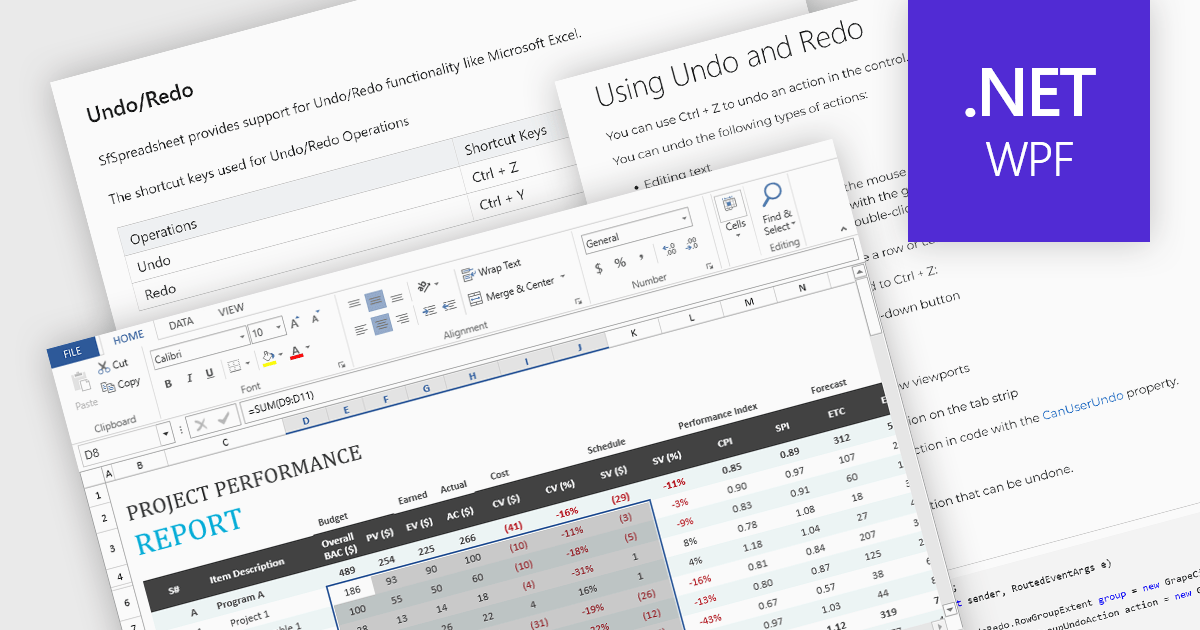
Undo and redo functionality in a spreadsheet allows users to reverse or reapply actions made during editing, providing a straightforward way to correct mistakes or recover changes. The undo option enables users to step back through recent actions, such as data entry, formatting, or formula adjustments, while redo restores any actions reversed by the undo function. This capability provides a safety net, allowing users to recover from unintended modifications, thereby enhancing productivity as it minimizes errors and streamlines the editing process.
Several WPF spreadsheet components allow you to redo and undo editing changes, including:
For an in-depth analysis of features and price, visit our WPF spreadsheet controls comparison.
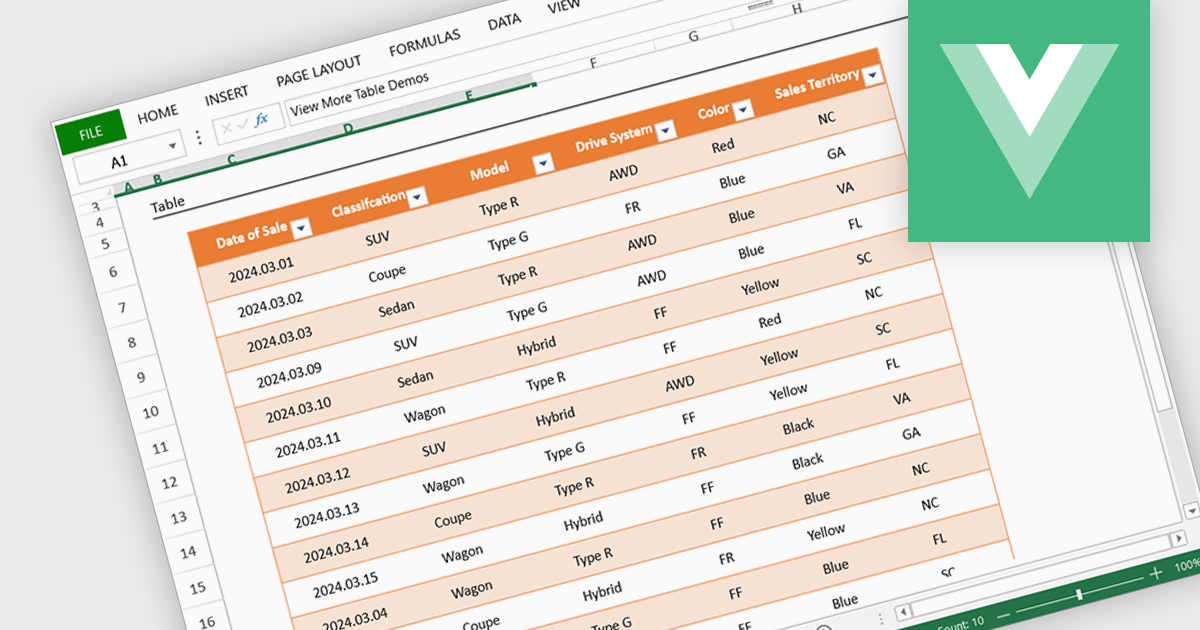
Spreadsheet display functionality allows developers to seamlessly integrate dynamic, tabular data into their applications. This capability enables users to visualize, analyze, and manipulate data directly within the application's interface, streamlining workflows and enhancing user experience. By providing a familiar and intuitive spreadsheet environment, developers can significantly improve data accessibility, comprehension, and productivity for their users.
Several Vue.js spreadsheet controls offer the ability to display spreadsheets including:
For an in-depth analysis of features and price, visit our Vue.js spreadsheet controls comparison.

Spread.NET by MESCIUS is a versatile spreadsheet component for .NET applications, enabling developers to integrate Excel-compatible functionalities into Windows Forms, WPF, ASP.NET, and Blazor. With features like advanced data visualization, pivot tables, conditional formatting, and customizable formulas, Spread.NET handles large data sets efficiently and allows seamless Excel import/export. This tool is ideal for applications needing robust data analytics and reporting, such as financial software and business intelligence solutions, enhancing user experience with a familiar spreadsheet interface.
In this blog post, MESCIUS Product Marketing Specialist Mackenzie Albitz shows you how to use Spread.NET to efficiently manage data within your applications when you encounter text that needs to be split into columns. Steps include:
Detailed sample code is included that you can use as a foundation for your applications.
Read the full blog to get started using this powerful capability of Spread.NET.
Spread.NET is licensed per developer and is available as a Perpetual License with a 12 month support and maintenance subscription. We can supply any Spread.NET license including new licenses, maintenance renewals, and upgrade licenses. See our Spread.NET licensing page for full details.
For more information, visit our Spread.NET product page.


Tel: (888) 850 9911
Fax: +1 770 250 6199


