


Official Supplier
As official and authorized distributors, we supply you with legitimate licenses directly from 200+ software publishers.
See all our Brands.
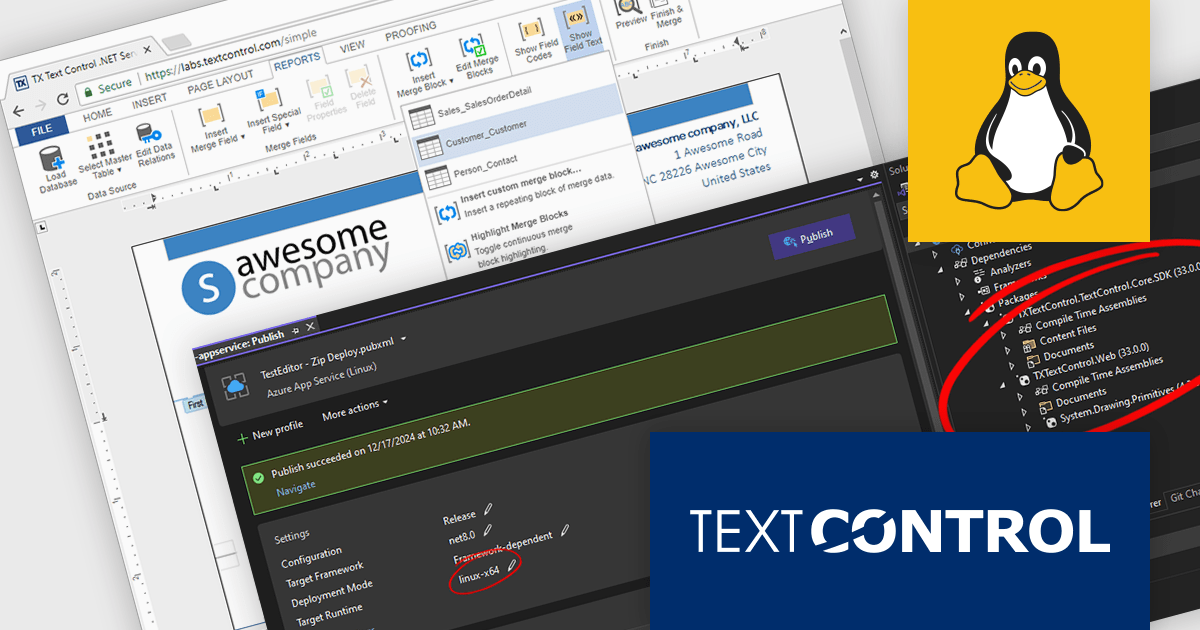
TX Text Control .NET Server for ASP.NET is a server-side component that equips your web applications with a powerful, Microsoft Word-compatible document editor. This allows you to develop applications that generate and edit various document formats (RTF, DOCX, PDF, etc.) on the fly, using data from databases or files. It also boasts features like PDF generation and a browser-based editor with a familiar MS Word-inspired interface, ultimately enhancing the document processing capabilities of your ASP.NET web applications.
The TX Text Control .NET Server for ASP.NET 33.0 release introduces powerful and flexible document processing capabilities for Linux, allowing developers to seamlessly integrate advanced editing, viewing, and processing features into their applications. With a focus on cross-platform compatibility, the software has been carefully optimized to deliver high-quality rendering, robust performance, and a smooth user experience on Linux systems. This new capability ensures a consistent and reliable workflow, making it easier than ever to build sophisticated, document-driven applications across diverse operating environments.
For a full list of changes in TX Text Control .NET Server for ASP.NET 33.0, see our release notes.
TX Text Control .NET Server for ASP.NET is licensed per developer and is available as a Perpetual License with a 12 month support and maintenance subscription. Run time licenses are required for the deployment to production servers. See our TX Text Control .NET Server for ASP.NET licensing page for full details.
For more information, visit our TX Text Control .NET Server for ASP.NET product page.
Kendo UI by Telerik is a comprehensive suite of JavaScript UI components designed to accelerate web application development. Offering pre-built, customizable elements for grids, charts, schedulers, and more, it streamlines UI creation across popular frameworks like jQuery, Angular, React, and Vue. Key features include responsive design, accessibility, and high performance, enhancing user experience. Developers benefit from reduced development time, consistent UI patterns, and the ability to build feature-rich applications faster.
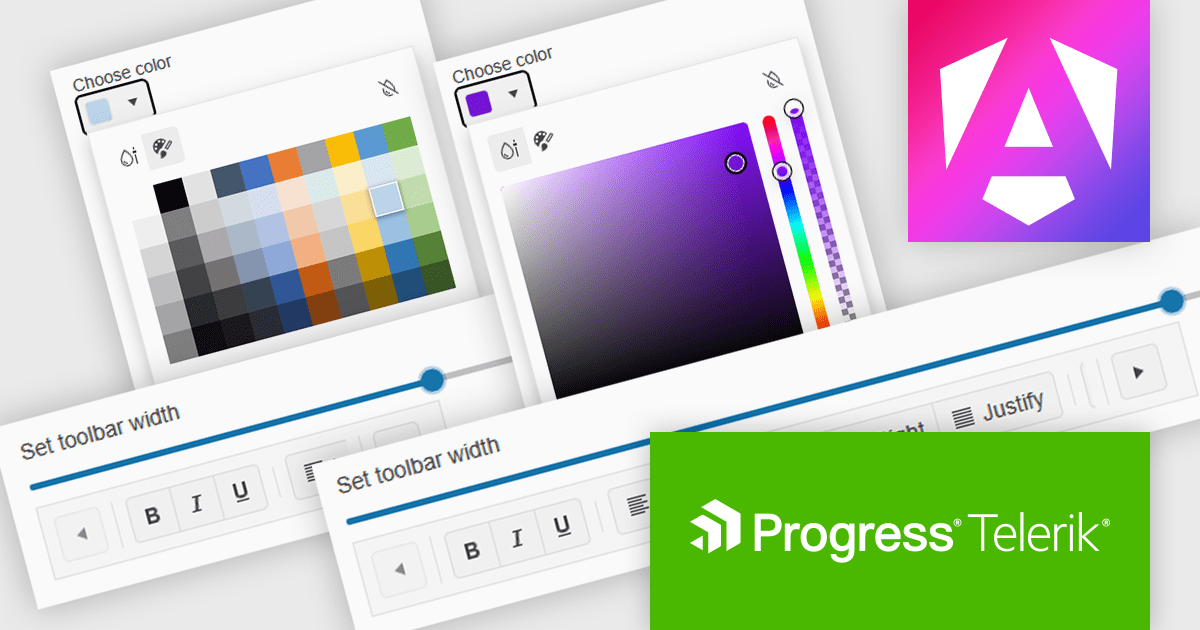
The Kendo UI for Angular (v18.1.0) update (part of Kendo UI 2025 Q1) introduces Adaptive Mode, enabling the ColorPicker, TabStrip, and Toolbar to dynamically adjust their rendering based on screen size, ensuring a seamless user experience across devices. This enhancement allows developers to deliver responsive and accessible interfaces without manual adjustments, as components automatically adapt to available space. The ColorPicker now presents a mobile-friendly action sheet for streamlined color selection, the TabStrip enables horizontal scrolling when tabs exceed container limits, and the Toolbar ensures tools remain accessible by intelligently managing overflow. By integrating Adaptive Mode, developers can simplify UI design, enhance usability, and improve cross-device consistency with minimal effort.
To see a full list of what's new in 2025 Q1 (v18.1.0), see our release notes.
Kendo UI is licensed per developer and has two licensing models: an annual Subscription License and a Perpetual License. The Subscription license provides access to the latest product updates, technical support, and exclusive benefits for a flat annual fee, and must be renewed to continue using the software. The Perpetual license is a one-time purchase granting access to the current released version and includes a one-year subscription for product updates and technical support. After this initial period, users can choose to renew the subscription element to continue receiving updates and support; otherwise, they may continue using the installed version available during their active subscription term but will forgo future updates and support. See our Kendo UI licensing page for full details.
Kendo UI is available individually or as part of the following products:
PDF4NET is a .NET library for generating, importing, and manipulating PDF documents on the fly from any .NET application. It does not rely on any Adobe products for creating or importing PDF files. PDF4NET hides the complex structure of PDF files behind a simple object model that allows creation of complex PDF files with a few lines of code.
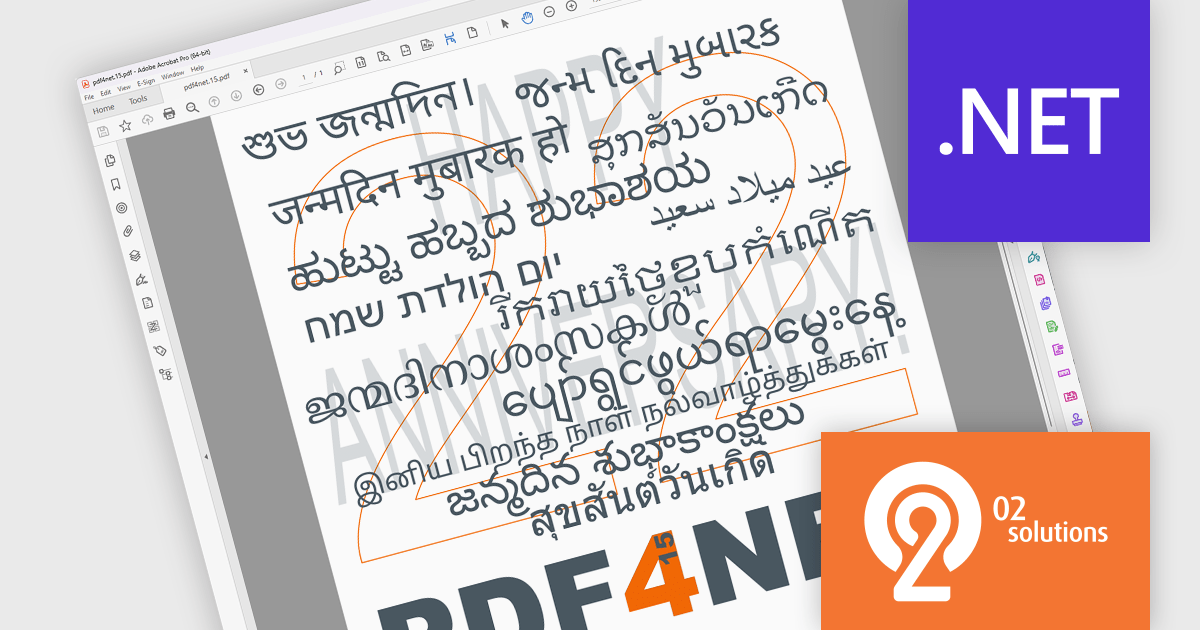
The PDF4NET 15.0.0 update enhances document processing by introducing support for complex scripts, including Arabic, Bengali, Devanagari, Hebrew, Khmer, Tamil, and Thai. This improvement ensures accurate text rendering, proper character shaping, and right-to-left script support, allowing developers to generate and manipulate PDFs with multilingual content more effectively. By enabling seamless integration of these scripts, the update enhances localization capabilities, improves accessibility, and ensures compliance with diverse linguistic requirements, making it easier to create globally compatible PDF documents without additional customization or external dependencies.
To see a full list of what's new in version 15, see our release notes.
PDF4NET is licensed per developer. All licenses include a 12 month subscription which provides all major and minor product updates and technical support. See our PDF4NET licensing page for full details.
PDF4NET is available individually or as part of PDFBundle4NET.
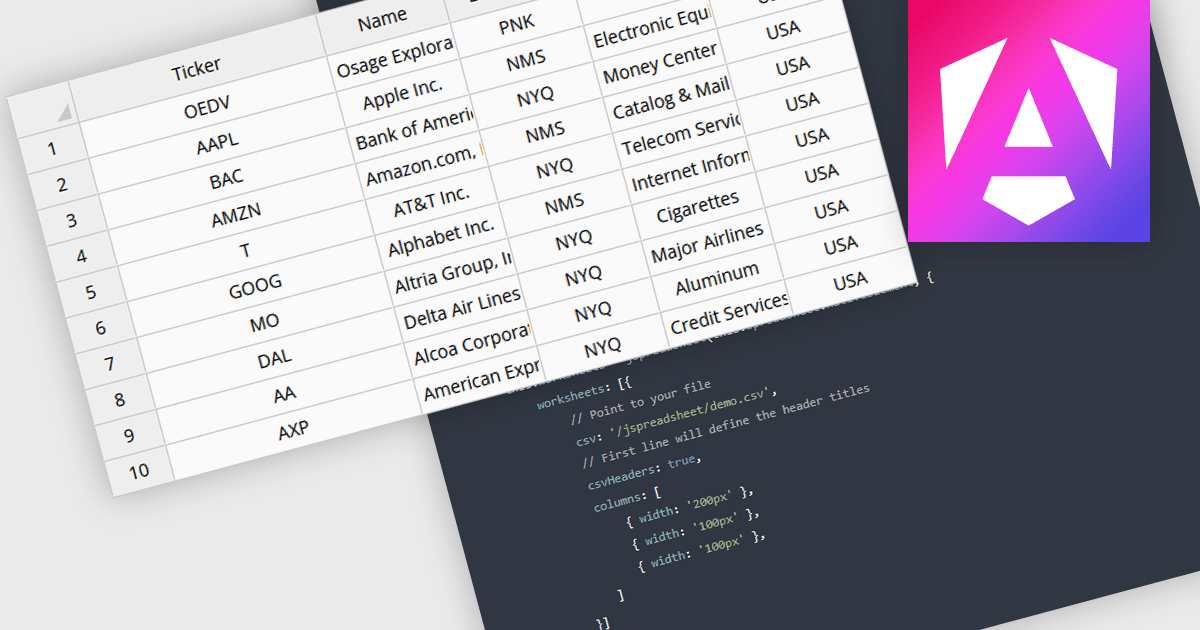
Grid controls with CSV/TSV data source support enable developers to seamlessly import, parse, and display structured tabular data from comma-separated or tab-separated files. This functionality simplifies data integration by eliminating the need for complex preprocessing, allowing users to work with large datasets efficiently. It enhances usability by providing built-in parsing mechanisms, automatic column detection, and flexible data binding, ensuring smooth interoperability with various data formats. By reducing manual effort and improving performance, this feature streamlines data-driven application development, making it easier to present, edit, and manipulate structured information within web-based interfaces.
Several Angular grid controls offer using CSV/TSV as a data source including:
For an in-depth analysis of features and price, visit our comparison of Angular grid controls.
GitKraken is a suite of developer tools built around Git, a popular version control system. It offers a graphical user interface (GUI) that allows developers to interact with Git repositories visually instead of relying on the command line. This simplifies complex Git workflows like resolving merge conflicts and visualizing code history, making Git more accessible and efficient for developers of all experience levels.
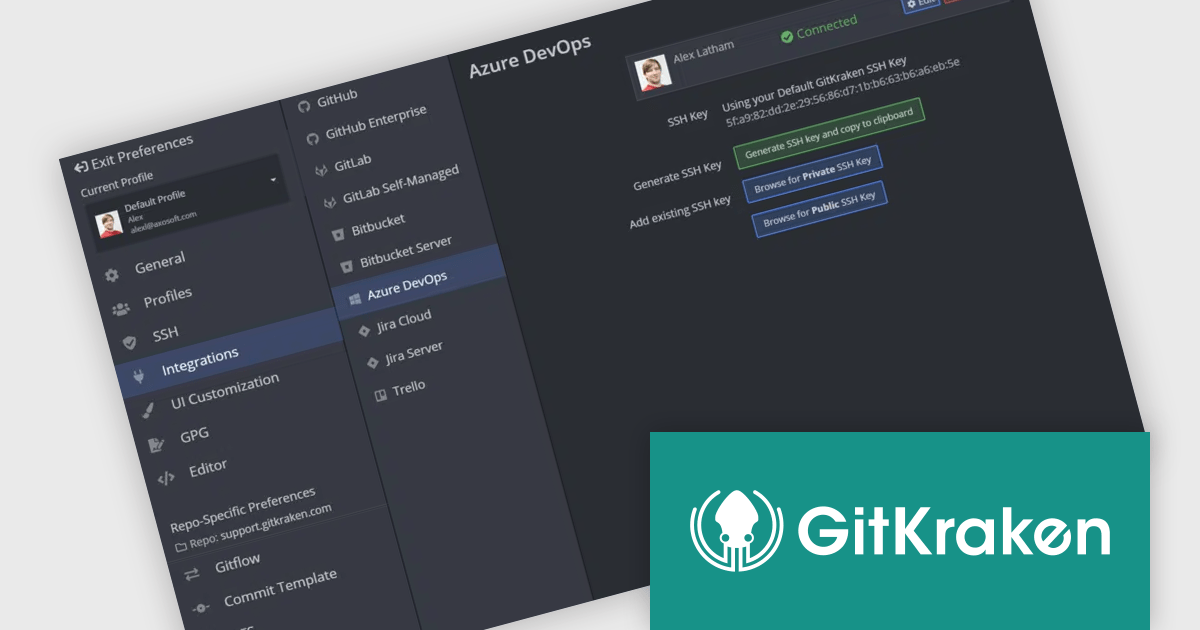
The GitLens for VS Code V16.3 release introduces robust integration with Azure DevOps, enabling users to access issues and pull requests directly within Visual Studio Code. This eliminates the need to switch between the editor and a web browser, saving time and reducing context switching. As a result, developers can stay focused on their code while managing tasks, reviewing pull requests, and collaborating with team members, ultimately enhancing productivity and efficiency.
To see a full list of what's new in V16.3, see our release notes.
GitLens for VS Code is part of GitKraken which is available as Cloud-based or On-Premise options, licensed per user as an annual license which includes free updates and technical support. See our GitKraken licensing page for full details.
Learn more on our GitKraken product page.


Tel: (888) 850 9911
Fax: +1 770 250 6199


