


Official Supplier
As official and authorized distributors, we supply you with legitimate licenses directly from 200+ software publishers.
See all our Brands.
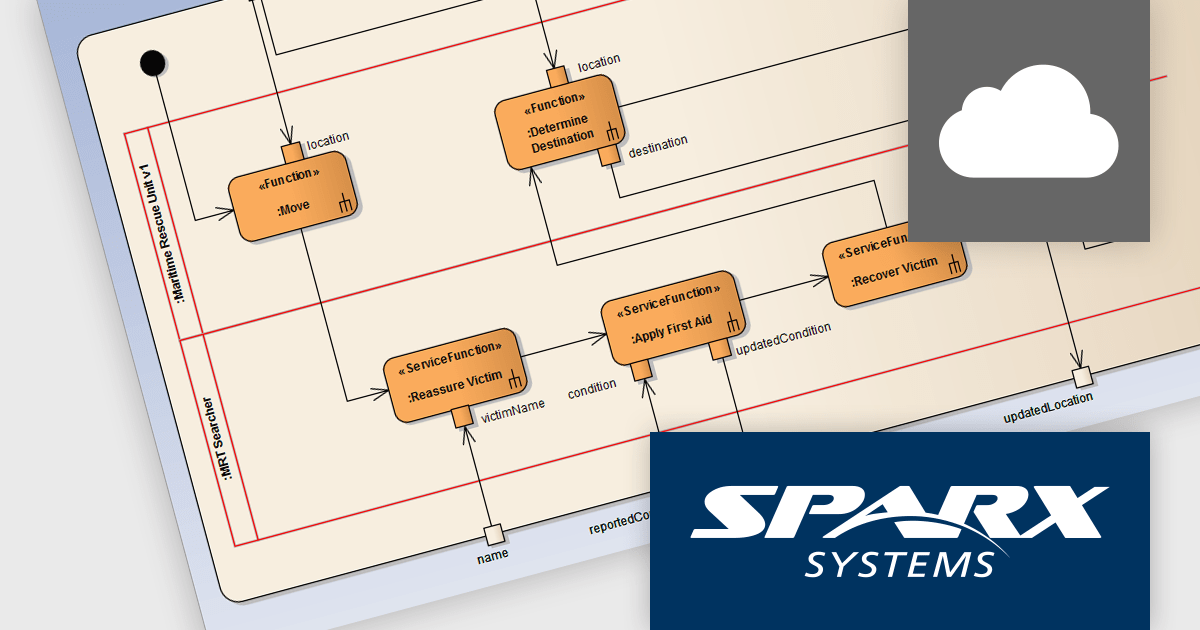
Pro Cloud Server by Sparx Systems is an enterprise-level solution designed to enhance collaboration, accessibility, and integration for teams using Enterprise Architect. It provides secure, web-based access to models, enabling real-time collaboration and seamless interaction with third-party tools via OSLC (Open Services for Lifecycle Collaboration), RESTful APIs, and cloud-based services. With features such as WebEA for browser-based model access, automated updates, version control, and improved performance for remote teams, Pro Cloud Server streamlines model management while reducing IT overhead. It is an essential tool for organizations seeking efficient, scalable, and interconnected model-driven development and system engineering workflows.
The Pro Cloud Server 6.0 update introduced significant enhancements to its OSLC capabilities, improving interoperability, model management, and external integrations. It now fully supports creating all elements from imported MDG Technologies, allowing for seamless use of custom modeling frameworks within OSLC interactions. Additionally, it enables OSLC consumers to retrieve diagram snapshots dynamically, enhancing visualization and historical tracking of model diagrams. Performance improvements in bulk synchronization reduce latency when updating and managing large-scale model repositories, while strengthened OSLC connectivity with third-party tools enables smoother data exchange and real-time collaboration. These advancements make Pro Cloud Server 6.0 a more powerful solution for enterprise-wide modeling and lifecycle management.
Pro Cloud Server is licensed annually and must be renewed each year to continue using the software. It is available in Team Server, Enterprise, and Token licensing options, offering flexibility for organizations of various sizes. Typically licensed per server, it may also require additional user-based or connection-based licensing, depending on the edition and functionality required . See our Pro Cloud Server licensing page for full details.
Learn more on our Pro Cloud Server product page.
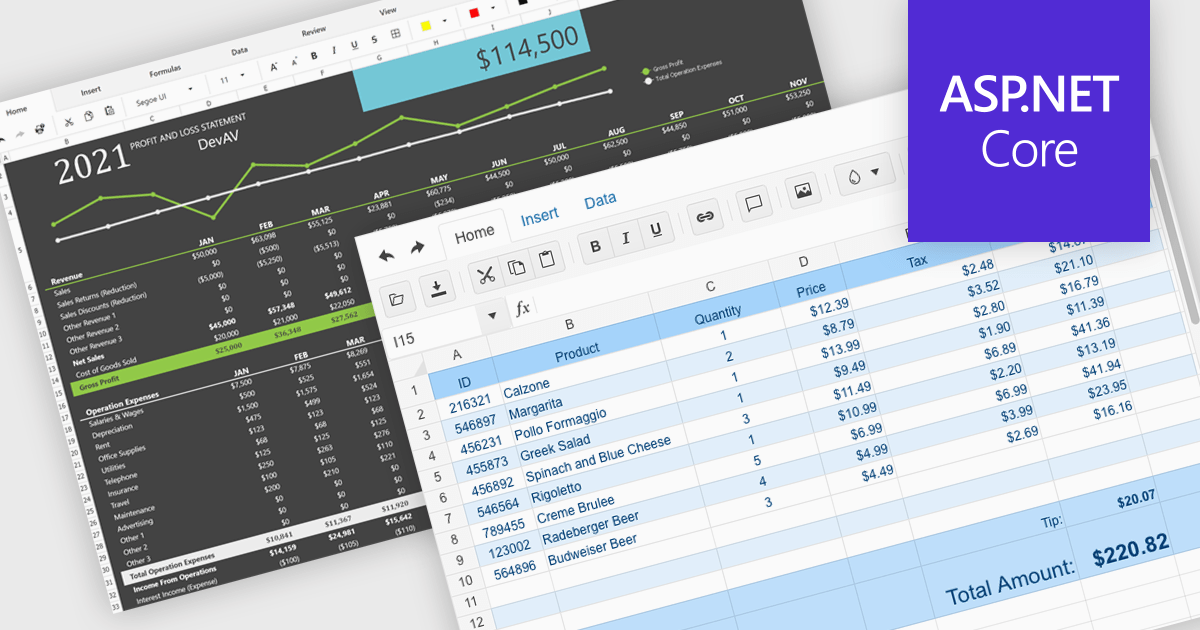
Modern spreadsheet components bring the power of Excel-like functionality to web applications, enabling users to create, edit, and manipulate data within an interactive grid. These components typically support formulas, formatting, data validation, and seamless integration with various data sources. Advanced features such as pivot tables, conditional formatting, and charting allow users to analyze and visualize data efficiently. Designed for performance and scalability, these spreadsheet controls cater to both enterprise applications and smaller projects that require robust data processing capabilities.
Several ASP.NET Core UI suites offer spreadsheet components including:
For an in-depth analysis of features and price, visit our ASP.NET Core UI suites comparison.
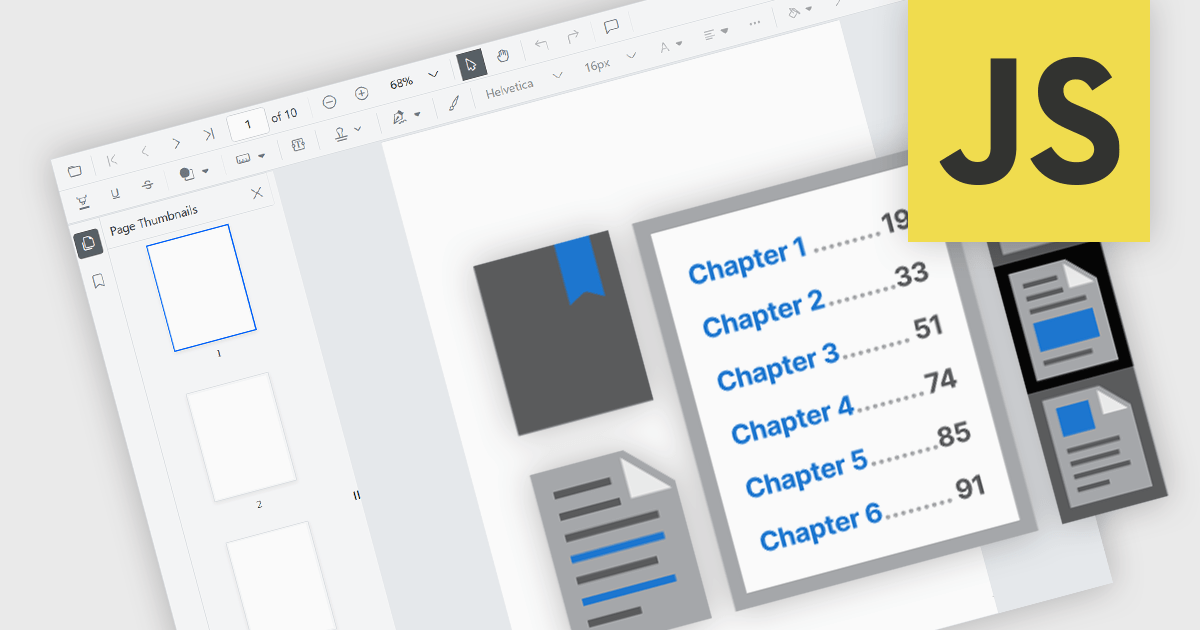
JavaScript PDF viewer components provide several features for the seamless and efficient navigation of complex documents, enhancing the user experience in web applications. These viewers allow users to move through PDFs using intuitive controls that support structured document exploration. By leveraging advanced navigation features, developers can integrate smooth, user-friendly access to content, whether through previews in the form of thumbnail images, internal links, or predefined document structures i.e. a table of contents.
Common features include:
For an in-depth analysis of features and price, visit our JavaScript PDF viewer components comparison.
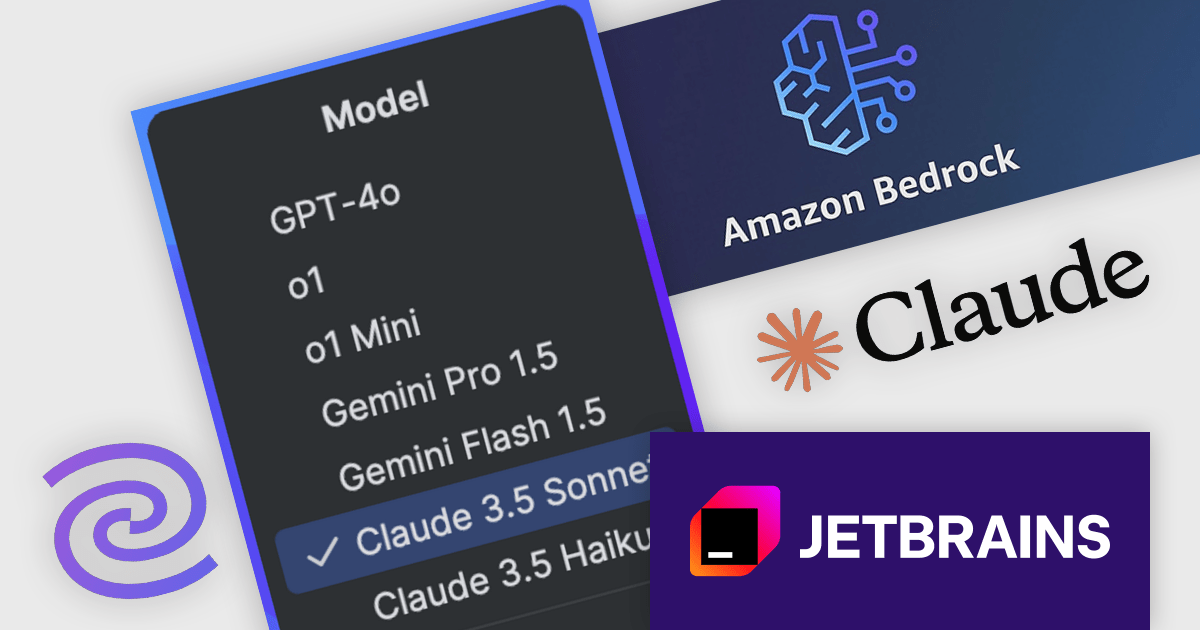
JetBrains AI Assistant - AI Pro is a plugin for JetBrains IDEs that uses large language models to enhance your coding experience. It can answer your questions about code, suggest completions and refactorings, and even help you write documentation and commit messages. It analyzes the context of your project to provide the most relevant suggestions, and you can chat with it directly within the IDE. JetBrains AI Assistant is a powerful tool for programmers looking to boost their productivity.
JetBrains introduces Anthropic Claude AI models via Amazon Bedrock in the 24.3.2 release of its IDEs, offering advanced AI-driven coding assistance exclusively to users with a paid AI Assistant subscription. This integration enhances productivity by providing intelligent code explanations, refactoring suggestions, test generation, and documentation support, all seamlessly embedded within the development workflow. With multi-model flexibility, developers can now leverage Claude models for their strong reasoning capabilities and efficient handling of complex programming tasks. Amazon Bedrock ensures reliable performance, low-latency responses, and global availability, enabling smooth AI assistance even under high demand.
JetBrains AI Assistant requires that you already own a JetBrains IDE product with an active commercial subscription license and is licensed per user as a commercial annual subscription. We can supply new subscriptions, subscription renewals, lapsed subscription renewals, and additional developer licenses. See our JetBrains AI Assistant licensing page for full details.
For more information, visit our JetBrains AI Assistant product page.
Highsoft is a Norwegian software publisher best known for Highcharts Core, a widely used JavaScript library for interactive data visualization. It specializes in developing powerful, flexible, and accessible charting solutions for developers, businesses, and data analysts. Highcharts is recognized for its seamless integration, extensive customization options, and support for a broad range of chart types, making it a popular choice for web applications and enterprise dashboards. Expanding its data visualization portfolio, Highsoft also offers Highcharts Dashboards, Highcharts Gantt, Highcharts Maps, and Highcharts Stock, catering to diverse analytical and reporting needs.
Highsoft has announced Highcharts Grid Lite, a forthcoming free solution that brings the core functionality of the data grid component in Highcharts Dashboards to a standalone, lightweight package. Designed for seamless integration into modern web applications, it offers high performance while remaining accessible and efficient. It supports WCAG-compliant interactions, ensuring usability across different environments. Its optimized row virtualization enables smooth handling of large datasets without performance degradation. Developers can easily integrate it with frameworks like React, Vue, and Angular while leveraging its intuitive API for streamlined data management and customization. With built-in CSS theming, it allows for flexible styling to match application requirements, making it a reliable solution for creating responsive, interactive tables.
Read the Highcharts Grid Lite blog post for more details on this advanced solution for building responsive, interactive data grids.
To explore the Highsoft product range, including Highcharts Dashboards, visit our Highsoft brand page.


Tel: (888) 850 9911
Fax: +1 770 250 6199


