Click for more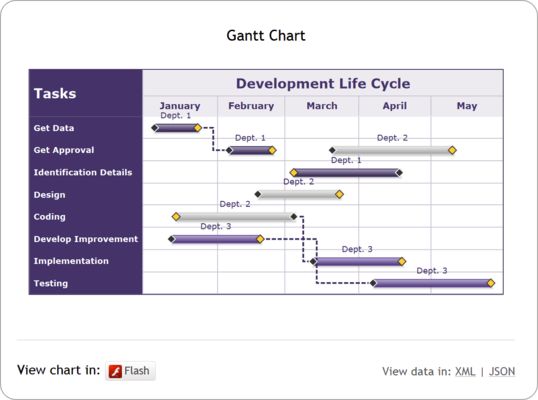
Gantt Chart
The Gantt chart is a specialized chart used for displaying various timelines like project timelines, development timelines etc. It can be used for any of the following; planning and scheduling projects, assessing how long a project should take, laying out the order in which tasks need to be carried out, managing dependencies between tasks and determining the resources needed.
In short, Gantt charts help you monitor progress of a project. You can immediately see what should have been achieved at a point in time. Also they allow you to judge how remedial action may bring the project back on course, if it’s running off track.
Click for more
Funnel Charts
Funnel charts are basically used to plot streamlined data, e.g. plotting sales data for sales pipeline analysis. A funnel chart consists of various segments, each representing a data set.
Click for more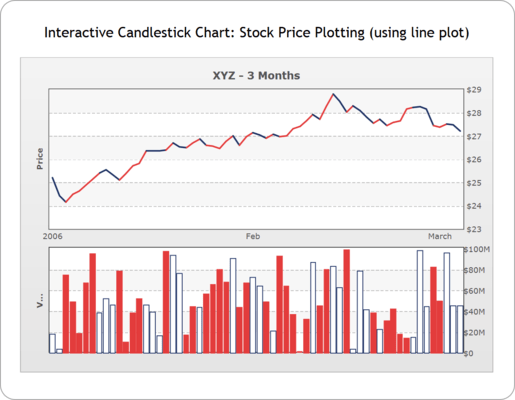
Candlestick Chart
The candle stick chart offers you a powerful and interactive interface to plot your stock data. It offers the following features: Integrated price and volume plot. Volume plot can be turned on or off. Multiple options for price plotting - Candle stick / bar / line. Interactive tool tip and customizable hover bar. Allows you to plot trend lines and zones on the chart. Apart from trend lines and zones, you can plot any number of custom trend sets on the chart. These trend sets can be customized to show any technical indicators. You can easily provide missing data using this chart. Any particular candle can be highlighted using color combination. Vertical indicator lines can be drawn at any point on x-axis.
Click for more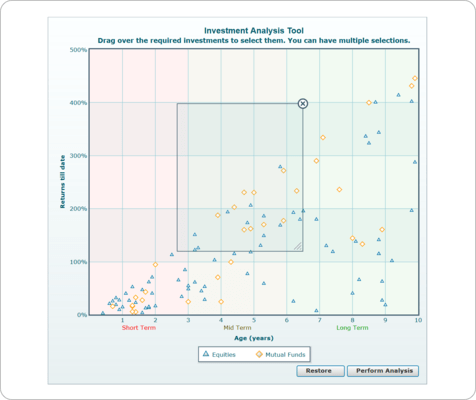
Select Scatter Chart
The Select Scatter chart is a special type of chart that allows users to visually select a subset of data from the given data points. Essentially, it's an extension of XY Plot Chart (Scatter Chart) from FusionCharts v3 with the added functionality of selecting any number of points on the chart and returning them back to server (or JavaScript functions for further processing).
Click for more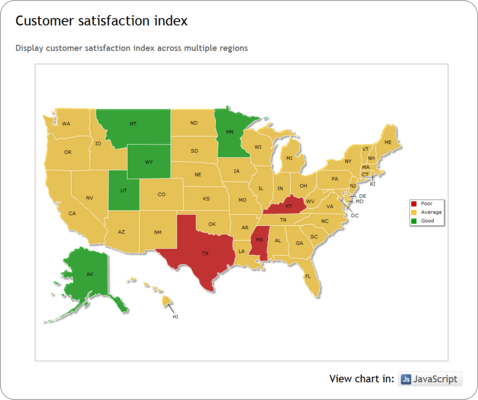
Customer Satisfaction Index
Display customer satisfaction index across multiple regions.
Click for more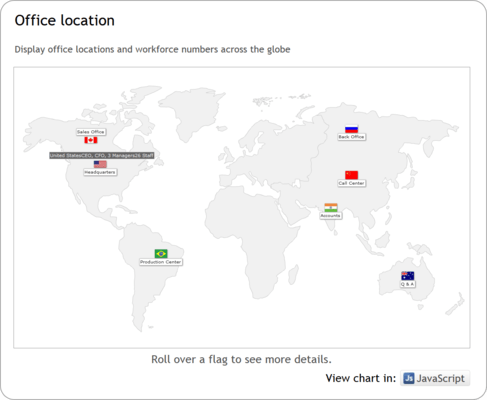
Office Locations
World Map showing office locations with markers.
Click for more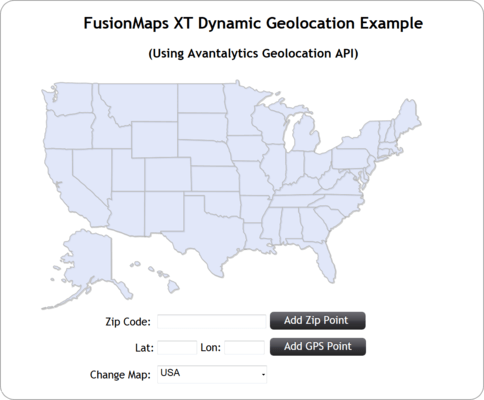
Geolocation - USA
The interactive map above utilizes Avantalytics' RESTful API to allow you to dynamically place any number of points on any FusionMaps XT U.S. map (including state maps) using either a zip code or GPS coordinates without having to pre-define the point ahead of time. Fast response times make it an ideal add-in for any dynamic mapping application.