TeeChart.NET for Xamarin.iOS
Charts, Maps and Gauges for iPhone/ iPad development environments.
Published by Steema Software
Distributed by ComponentSource since 1998
Prices from: ₩ 482,900 Version: 2019 Updated: Oct 11, 2018

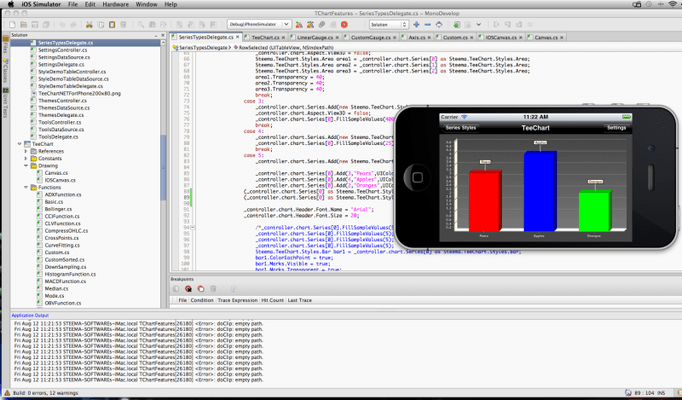

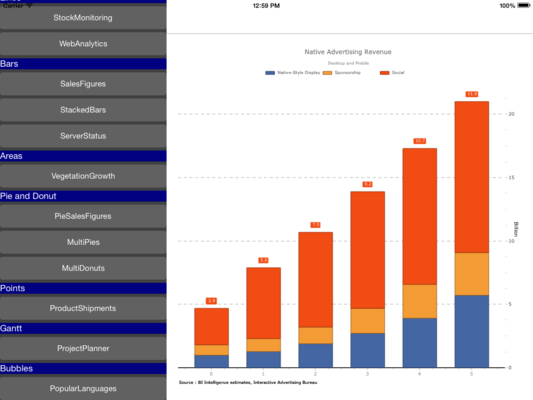
The Chart shows a stacked Basr Chart to represent results in possible response to different marketing campaigns.

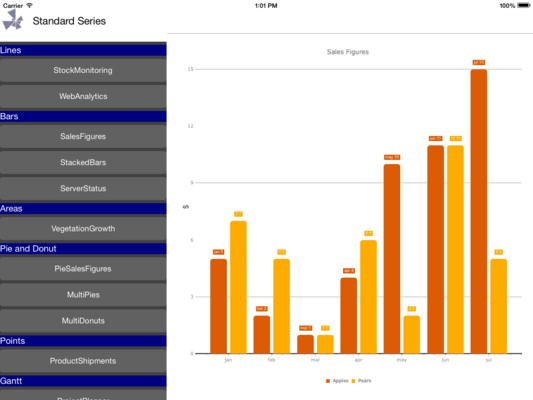
Sales Figures represented with vertical Bars Chart.

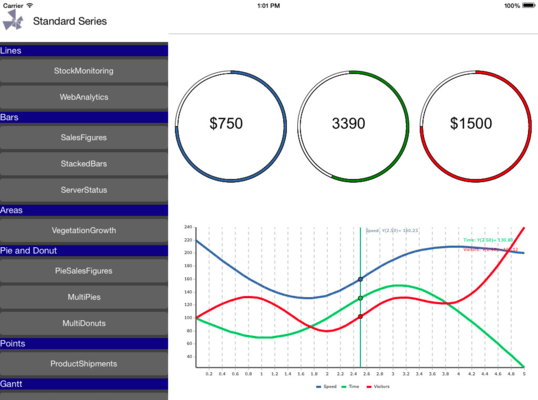
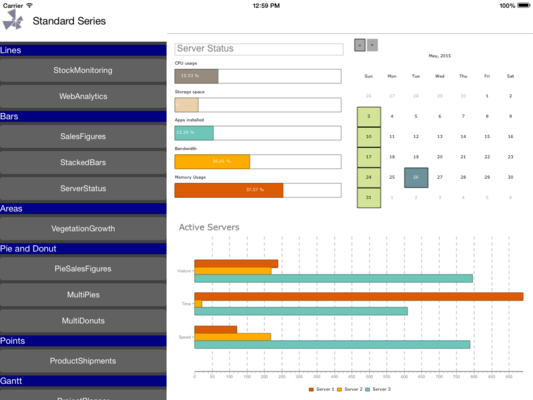
Dashboard example built with Xamarin.iOS consisting of 4 Charts, 3 Donuts and one Line Chart showing use of interpolation to dynamically obtain Series values.

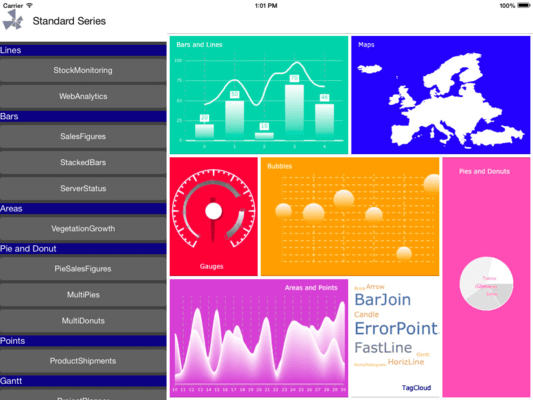
Demonstrates common chart styles.

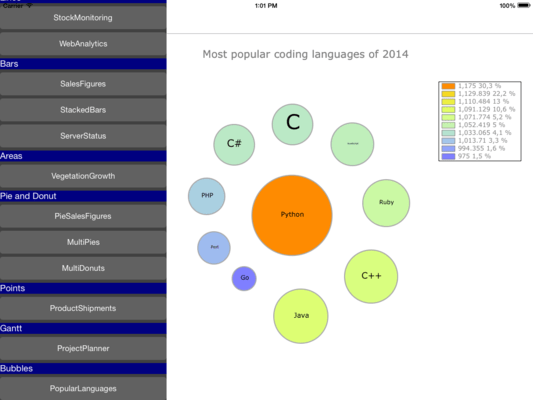
Bubble Cloud Series shows arranged Bubbles representing value by radius.

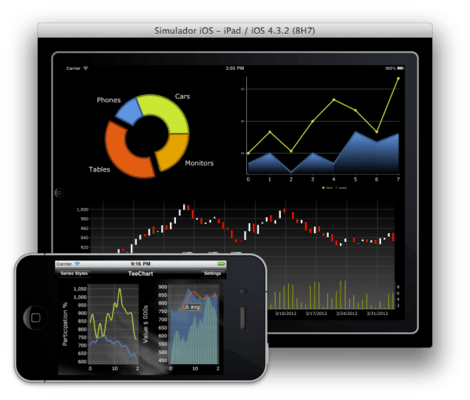
Composite pages may be built using different Charts. This example shows both an iPad and an iPhone displaying Line, Donut, Area Candle (Open, Low,High,Close) data series.

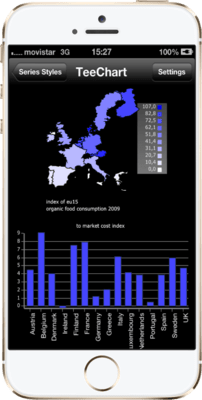
Example of geographic data represented on an iPhone.


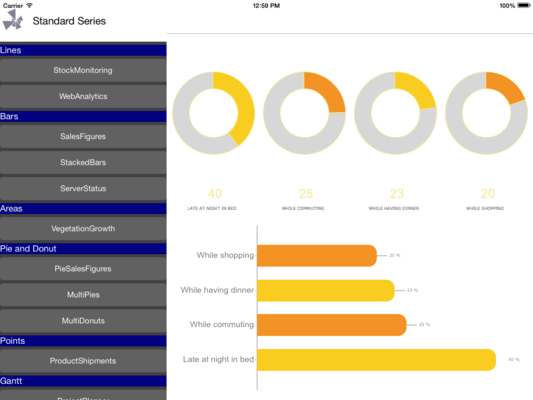
Combination Multi Pie and Horizontal Bar Chart to represent different data values.