Chart Components News

RSS Feed

Accelerate Web Apps with .NET 9 Support

February 24, 2025Product Update
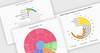
Smart UI Blazor components now fully support .NET 9, ensuring faster performance and enhanced stability for modern web applications.

Visually Compare Variations Across Data Points

February 24, 2025Feature Highlight
Equipping Angular applications with range bar charts enables the display of value ranges, useful for visualizing fluctuations in metrics such as price.

Turn Raw Data into Insights with Real-Time Updates

February 24, 2025Product Update
Kendo UI for jQuery v2025 Q1 adds a Chart Wizard for data-driven chart creation, enhancing visualization and workflow efficiency.

Import and Export Excel XLSX Using Blazor

February 18, 2025Feature Highlight
SpreadJS by MESCIUS lets you import and export Excel files in your Blazor application, bringing powerful spreadsheet functionality to the web.

Simplify Chart Labeling with Optimized Text Series

February 17, 2025Product Update
LightningChart JS v7.0.1 adds a high-performance Text Series API for ChartXY, improving text rendering for enhanced usability and efficiency.

Enhance Data Visualization in .NET with Radial Charts

February 14, 2025Feature Highlight
Radial charts such as circular bar and sunburst provide an intuitive way to compare categories and uncover relationships within a dataset.

Build Smarter Angular Apps with Data Tables

February 11, 2025Feature Highlight
Enhance your Angular app with Wijmo FlexGrid by MESCIUS, a powerful data table component offering enterprise-level performance and features.

Simplify Customization with Light and Dark Modes

February 4, 2025Product Update
DevExpress Blazor v24.2 adds Light and Dark Modes with WCAG-compliant contrasts and streamlined theming for a modern, accessible design.

Achieve Optimal Clarity with Zoom Toolbars

February 4, 2025Product Update
Syncfusion Essential Studio JavaScript 2024 Volume 4 adds draggable zoom toolbar positioning for fully customizable and user-friendly chart layouts.

Simplify Analytics with Compact Sparkline Charts

January 29, 2025Feature Highlight
Easily identify trends, monitor real-time changes, and enhance data readability with space-saving sparklines embedded into your app.

Control Focus with Drag and Drop Splitter Line

January 29, 2025Product Update
LightningChart JS Trader v3 enhances customization with draggable splitter lines, allowing seamless resizing of indicator segments.

Enhance Engagement with Interactive Chart Rotation

January 21, 2025Product Update
Stimulsoft Dashboards.WIN 2025.1.1 adds interactive rotation for pie and doughnut charts, for dynamic data exploration and customized viewing.

Identify Patterns with Intuitive Price Insights

January 20, 2025Feature Highlight
Candlestick charts enhance precision with detailed price insights, helping predict trends through precise tracking of price movements and trends.

Enhance Dashboards with Responsive Charts

January 17, 2025Product Update
MDB Pro for Vue provides powerful, dynamic charting tools to help you create visually engaging and interactive dashboards with ease.

Highlight Chart Dimensions with Clear 3D Axis Titles

January 14, 2025Product Update
Stimulsoft Dashboards.PHP 2025.1.1 adds customizable axis titles for 3D charts, enhancing data clarity and enabling precise visualization.

Pinpoint Data with Accurate Chart Navigation

January 13, 2025Product Update
Syncfusion Essential Studio ASP.NET MVC 2024 Volume 4 enhances chart precision with Crosshair Snap, ensuring effortless focus on data points.

Track Chart Data with Selective Trackball Activation

January 10, 2025Product Update
Syncfusion Essential Studio Flutter 2024 Volume 4 adds trackball for individual series, enabling precise data tracking and chart interactions.

Let Users Scroll Directly to Key Data Points in a Grid

January 10, 2025Product Update
Telerik UI for ASP.NET Core 2024 Q4 introduces scroll-to-item functionality, streamlining navigation in large data sets for faster, focused interactions.

Compare Metrics with Multiple Line Representations

January 7, 2025Feature Highlight
Line charts allow the visualization and comparison of multiple data sets, highlighting relationships, trends, and contrasts to reveal correlations.

Ensure Compliance with Highcharts License Updates

January 6, 2025Publisher Update
Highcharts reclassifies public website deployments under the SaaS License, requiring some users to update agreements to align with the new terms.