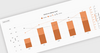
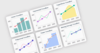
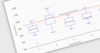
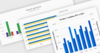
Chart Components News

RSS Feed

Build Cross-Platform UIs with .NET 9 Support

June 5, 2025Product Update
Nevron Open Vision for .NET 2025.1 adds support for .NET 9, providing enhanced performance, security, and cross-platform consistency.

Develop Angular Apps with Pre-Built UI Controls

June 5, 2025Feature Highlight
Angular UI suites provide a comprehensive set of components that reduce development time and ensure consistency across complex web apps.

Visualize Massive Datasets with Zero Lag

June 3, 2025Product Update
NOV Chart for .NET 2025.1 adds GPU-accelerated Fast Bar, Fast Line and Fast Point series to render millions of data points in real time.

Add Precision to Time-Based Data

June 2, 2025Product Update
LightningChart JS v7.1 brings nanosecond-level precision to time-based charts, enabling ultra-detailed analysis of high-frequency temporal data.

Ensure Accessibility and Data Clarity for All Users

June 2, 2025Feature Highlight
Comply with WCAG standards and deliver clear, accessible information through intuitive JavaScript charts.

Celebrating 3 Year Partnership with Blazorise

June 2, 2025Publisher Milestone
ComponentSource and Blazorise have worked together since 2022 to provide developers with high-performance Blazor UI components.

Visualize Key Data In Vue.js Reports

May 22, 2025Feature Highlight
Incorporating charts in reports transforms raw data into clear, engaging visuals that highlight key metrics for more informed decision-making.

Access Live Chart Data Through JavaScript APIs

May 22, 2025Feature Highlight
React chart controls can retrieve up-to-date data on demand by integrating with custom JavaScript APIs for dynamic visual displays.

Explore Powerful AI-driven Features in your JavaScript Spreadsheets

May 22, 2025Feature Highlight
SpreadJS 18.1 includes a developer preview of AI Features for Natural Language and Smart Analysis.

Bunifu Technologies Adds .NET 9 Support

May 19, 2025Publisher Update
The Bunifu product range can now be used to integrate modern user interface and charting components in the Microsoft .NET 9.0 ecosystem.

Accelerate Web Development with Blazor UI Controls

May 19, 2025Feature Highlight
Blazor UI suites offer high-performance components, such as grids or charts, for building scalable, consistent, and maintainable applications.

Fix Chart Tooltip Placement without Custom Code

May 15, 2025Product Update
Highcharts 12.2 introduces a declarative way to control tooltip placement, eliminating the need for manual JavaScript adjustments.

Reach More Users with Accessible Chart Designs

May 14, 2025Feature Highlight
High contrast charts enhance accessibility, improving comprehension and inclusivity in reports, dashboards, and presentations.

Build Web Apps Faster with .NET Core-Only Designer

May 9, 2025Product Update
Wisej.NET v4 adopts a .NET Core-only designer, enabling developers to leverage modern .NET features, simplifying and future-proofing projects.

Compare Trends with Multi-Series Spline Charts

May 8, 2025Feature Highlight
Visualize evolving relationships between multiple datasets and effectively identify correlations over time with multi-series spline charts.

Celebrating 5 Year Partnership with FusionCharts

May 7, 2025Publisher Milestone
ComponentSource and FusionCharts have worked together since 2020 bringing powerful data visualization tools to developers worldwide.

Advance Your Data Visualizations in .NET 9 Projects

April 24, 2025Product Update
LightningChart .NET v12.2.1 adds Microsoft .NET 9 support to provide high-performance charting capabilities in the latest .NET framework.

Visualize Trends with Dynamic Timeline Charts

April 23, 2025Product Update
amCharts 5 adds a distinctive Timeline chart for space-efficient and visually interesting linear data representation using serpentine and spiral layouts.

Simplify Total Value Tracking in Charts

April 22, 2025Product Update
Syncfusion Essential Studio ASP.NET MVC 2025 Volume 1 adds a new option to show cumulative totals directly in stacked chart labels.

Reveal Correlations with Visual Data Points

April 17, 2025Feature Highlight
Visually explore relationships, outliers, and data ranges with intuitive scatter charts, enabling clear understanding and informed analysis.