Chart Components News

RSS Feed

Visualize Multidimensional Data with Radar Charts

November 15, 2024Feature Highlight
Analyze trends and compare performance metrics with the precision, visual clarity, and interactivity of Angular polar and radar charts.

Manage Projects in your React Applications

November 8, 2024Feature Highlight
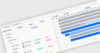
Gantt controls provide users with a way to visually break down complex projects into manageable steps and maintain focus on key objectives.

Build Precise Data Visuals with Smart Tag Support

November 1, 2024Product Update
Syncfusion Essential Studio Windows Forms 2024 Volume 3 enhances data visualization efficiency with new smart tagging for BulletGraph.

Track Data Insights with Interactive Bullet Charts

October 30, 2024Feature Highlight
Effortlessly monitor performance goals with responsive React bullet charts that deliver real-time insights and drive smarter decisions.

Capture and Preserve Charts in a Static Image File

October 25, 2024Feature Highlight
Transform charts into static images for effective communication and data sharing across platforms and devices.

Unlock Speed and Fluidity with 3D Capabilities

October 23, 2024Product Update
LightningChart .NET v12.1.1 enhances 2D and 3D interactions with refined zooming, rotation, and panning, improving navigation for large datasets.

Elevate Chart Visualization with Interactive Tooltips

October 16, 2024Feature Highlight
Empower users with contextual information and enhance chart understanding through intuitive tooltips.

Visualize Your Project Goals with Gantt Charts

October 10, 2024Feature Highlight
Teams can use Gantt charts to visually break down complex projects into manageable steps and maintain focus on key objectives.

Easily Visualize Progress in WPF Applications

October 10, 2024Feature Highlight
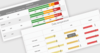
Bullet graphs provide a compact, easily understood method of data visualization, combining several metrics to measure performance.

Create Customizable Charts for .NET Blazor

October 9, 2024Product Update
MindFusion.Charting for .NET Blazor lets you seamlessly add, style, and render charts and dashboards with ease.

Transform Data Visualization with 3D Graph Engine

October 7, 2024Feature Highlight
Big Faceless Graph Library supports adjustable light sources and lifelike depth perception, helping produce customizable graphs.

Learn How to Build a WPF Gantt Chart Control

October 4, 2024Feature Highlight
Use the ComponentOne C1GanttView control to achieve powerful Gantt chart functionality in your WPF applications.

Deliver Real-Time Data Visualization

October 2, 2024Feature Highlight
.NET 8 WPF charts with live data support enable seamless real-time charting and insights for an improved user experience.

Enhance Data Visuals with Triangulated HeatMaps

October 1, 2024Product Update
Nevron Chart for SSRS 2024.1 adds a new HeatMap variation that enables faster insights into complex data with precise elevation mapping.

Provide a Chronological Visualization of Data Points

September 24, 2024Product Update
Smart UI v20.0.0 adds a new component that provides developers with a streamlined way to create interactive and informative timelines.

Enhance Engagement with Smooth Data Transitions

September 23, 2024Product Update
Syncfusion Essential Studio JavaScript 2024 Vol 3 allows users to update, add, or remove chart data with animations, enhancing engagement.

Create Charting Apps with Enhanced Accessibility

September 20, 2024Product Update
ZingChart 2.9.15 adds new keyboard navigation and speech support, empowering users of all abilities to explore, analyze and understand data.

Steema VCL Products Add RAD Studio 12.2 Support

September 19, 2024Publisher Update
TeeChart VCL/FMX and TeeGrid VCL/FMX now support the latest release of Delphi and C++Builder from Embarcadero.

Enhance Data Visualization with Area Charts

September 18, 2024Feature Highlight
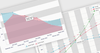
Unlock deeper insights with interactive, visually appealing displays that make complex datasets accessible and engaging for your audience.

Elevate Your React Apps with Dynamic Pie Charts

September 11, 2024Feature Highlight
Visualize data with clarity and impact using intuitive pie charts that deliver accurate, easily understood data insights.