








Official Supplier
As official and authorized distributors, we supply you with legitimate licenses directly from 200+ software publishers.
See all our Brands.
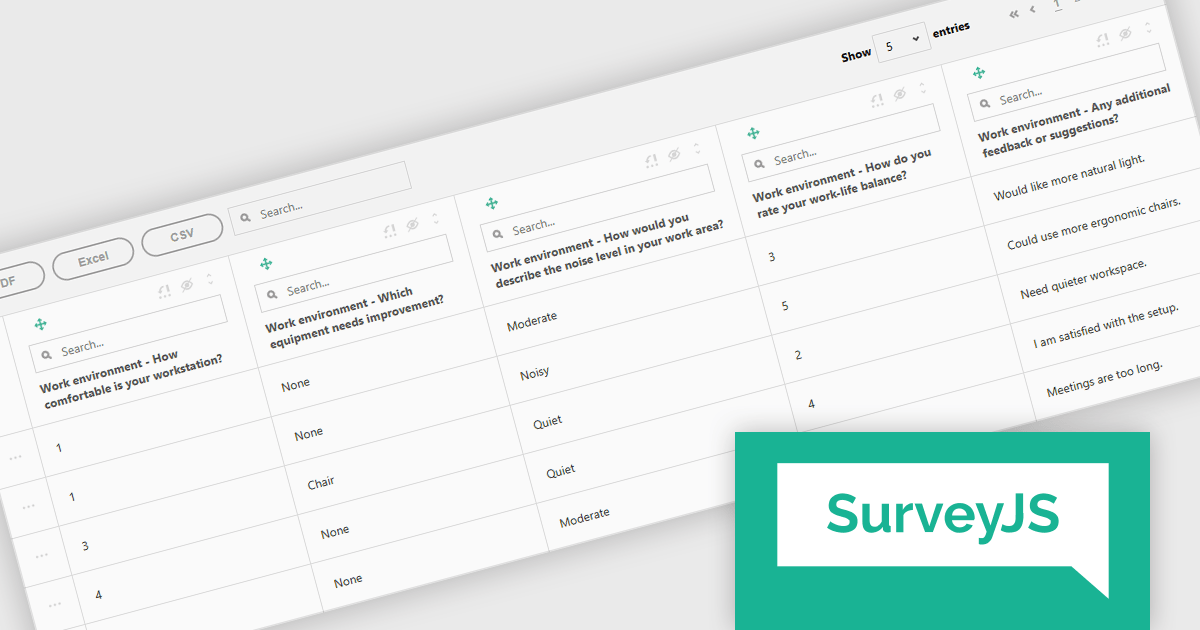
SurveyJS Survey Creator is a JavaScript library that enables developers to embed a drag-and-drop survey and form builder directly within their web applications. It provides a comprehensive UI for designing surveys with various question types, logic branching, and layout customization, generating JSON schemas that can be used by the SurveyJS Survey Library to render and process the surveys. This allows for the creation of dynamic and user-configurable data collection tools without requiring extensive custom development, streamlining the process of integrating survey functionality into applications.
The SurveyJS Survey Creator 2.3.9 update introduces support for specialized and composite question types within the Table View, enabling developers to efficiently display and analyze complex survey structures in a unified interface. This enhancement allows multiple question types such as numeric ratings, text responses, and categorical selections to be reviewed side by side, improving clarity and reducing the need for manual data consolidation. By supporting composite questions, the update simplifies the process of working with interrelated data points, helping developers deliver accurate reporting and improving survey analysis.
To see a full list of what's new in version 2.3.9, see our release notes.
SurveyJS Survey Creator is licensed per developer with a one-time payment for indefinite use. Access to updates and technical support is available through a subscription. See our SurveyJS Survey Creator licensing page for full details.
Learn more on our SurveyJS Survey Creator product page.
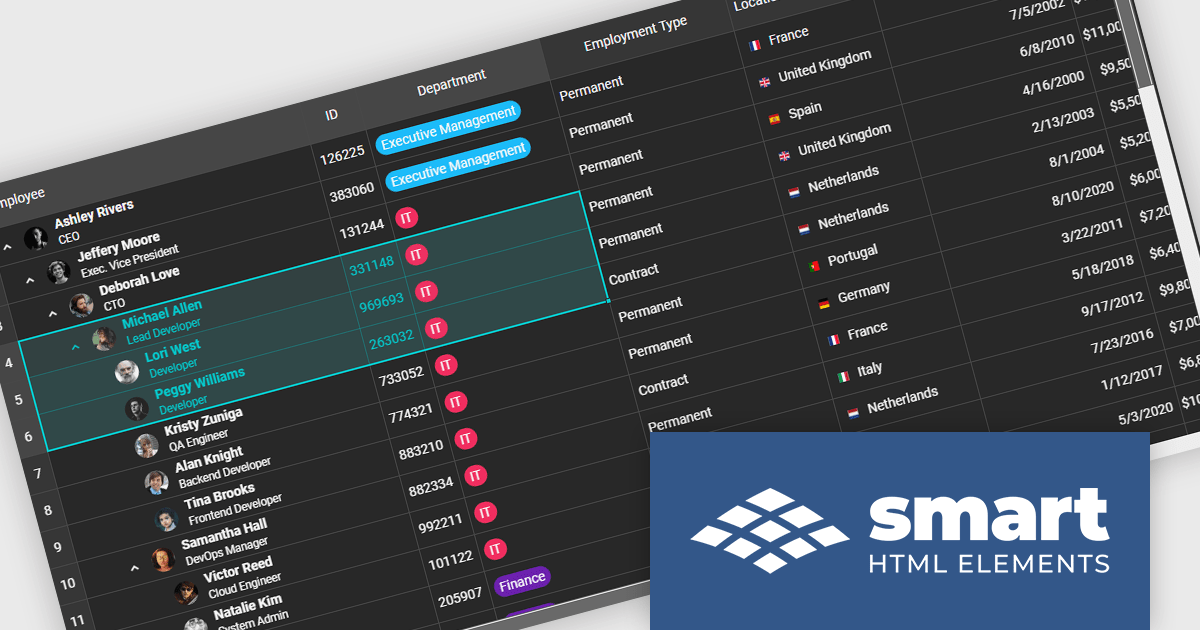
Smart UI by Smart HTML Elements is an enterprise-grade UI library offering pre-built web components for developers in Angular, React, Vue, Blazor, and JavaScript. It boasts over 60 ready-to-use components like grids, charts, schedulers, and editors, all featuring two-way data binding, responsiveness, accessibility, and theming capabilities. This library helps developers rapidly build dynamic and modern web applications with consistent look-and-feel and rich functionalities, accelerating development time and ensuring professional quality.
The Smart UI v24.0.0 release adds support for grid spreadsheet extensions which bring familiar spreadsheet‑style formatting and editing capabilities into the Smart UI grid component. Users can now apply formatting like bold, italic, underline, strike‑through, and set background or text colors directly in cells, much like working in Excel. These extensions also improve usability via selection behaviors, keyboard navigation, copy‑paste, and merging or spanning cells, making it easier for end users to manipulate tabular data without switching between tools. For developers and enterprises, these features mean reduced friction in building data‑heavy applications (dashboards, admin UIs, reporting tools), faster time to market since fewer custom implementations are required, and richer user experience for non-technical users accustomed to spreadsheet interfaces.
To see a full list of what's new in v24.0.0, see our release notes.
Smart UI (Smart HTML Elements) is licensed per developer and is available as a perpetual license with 1 year support and maintenance. It includes distribution to unlimited Web applications, SaaS projects, Intranets and Websites. Team, OEM and Enterprise licensing options are also available. See our Smart UI (Smart HTML Elements) licensing page for full details.
Learn more on our Smart UI (Smart HTML Elements) product page.
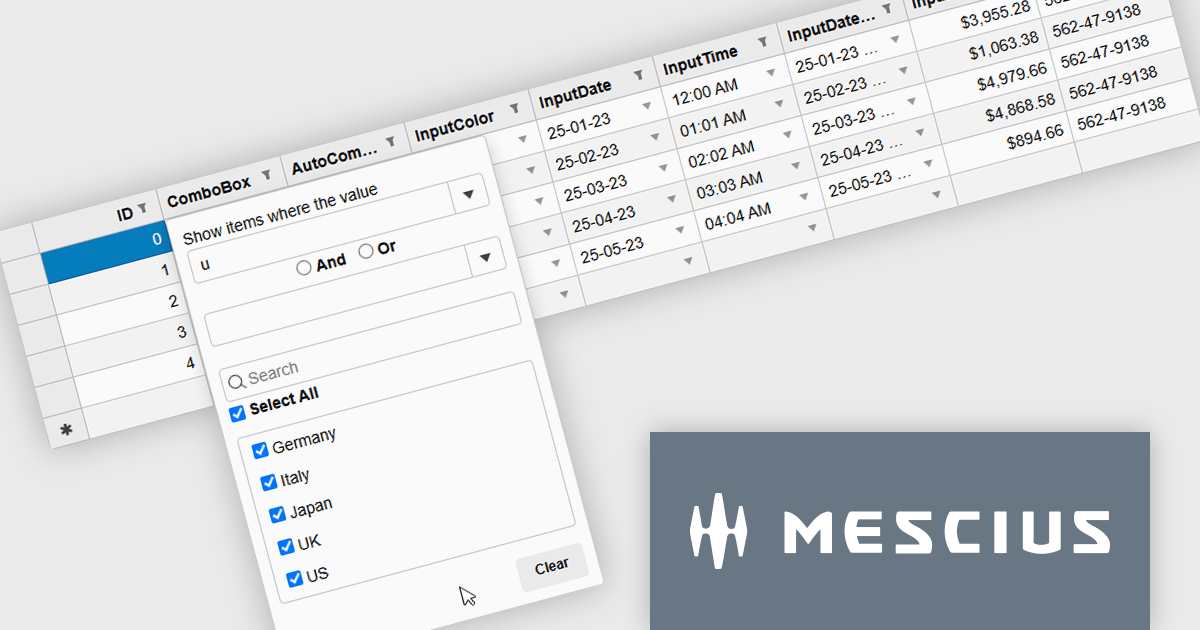
Wijmo by MESCIUS is a comprehensive JavaScript library offering a suite of high-performance UI components and data grids specifically designed to streamline the development of modern enterprise applications. It emphasizes reduced development time and improved maintainability, along with a focus on performance through its efficient design and small module size. Wijmo integrates seamlessly with popular JavaScript frameworks like Angular, React, and Vue.js, and supports cutting-edge technologies like TypeScript, making it a versatile solution for building complex web applications.
The Wijmo 2025 v2 update introduces a new MultiFilter feature in FlexGridFilter, giving developers the ability to apply both conditional and value filters simultaneously. Previously, users were limited to selecting one filter type at a time, which restricted flexibility when building complex data queries. With MultiFilter, developers can now define precise filtering logic that combines conditions and specific values in a single operation, enabling more efficient data exploration and analysis. This enhancement reduces the need for manual filtering steps and provides a more intuitive experience for end users who require granular control over their data views.
To see a full list of what's new in 2025 v2, see our release notes.
Wijmo is licensed per developer. Developer Licenses are perpetual and include 1 year Subscription which provides upgrades, including bug fixes and new features. See our Wijmo licensing page for full details.
Learn more on our Wijmo product page.
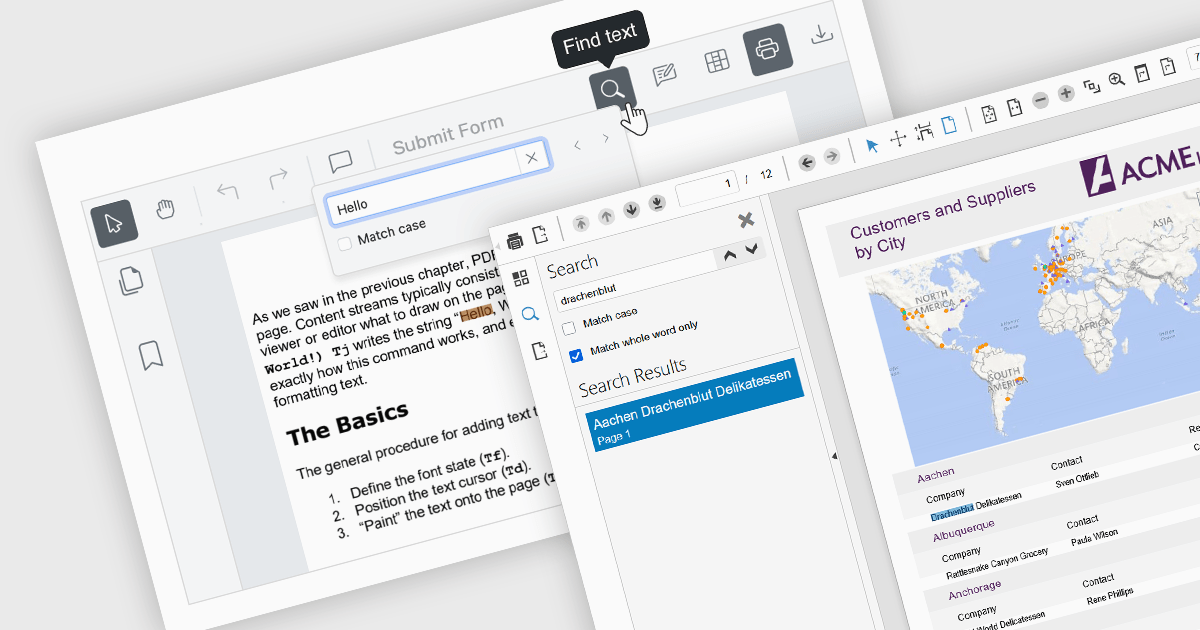
Text searching functionality in a PDF viewer allows users to quickly locate specific words or phrases within a PDF document by entering the keywords into a search field built into the viewer. It works by scanning the text layer of the PDF, highlighting matching results, and enabling fast navigation between the occurrences. Considered as baseline functionality, this very widely used feature provides an important benefit by eliminating the need to manually scroll and read through content, saving a significant amount of time when finding relevant information, especially in lengthy, complex or densely formatted documents.
Several Angular PDF viewer components allow you to search text, including:
For an in-depth analysis of features and price, visit our comparison of Angular PDF viewer components.
Aspose.Page for JavaScript via C++ and Aspose.Page for Node.js via C++ are lightweight, cross-platform APIs designed for working with Page Description Language (PDL) files, including XPS, PostScript (PS), and Encapsulated PostScript (EPS) formats. Built on a high-performance C++ core and exposed via WebAssembly or Node.js bindings, these libraries allow developers to load, view, convert, and manipulate PDL documents entirely in client-side or server-side JavaScript environments. The APIs support conversion to PDF and a wide range of raster image formats (JPEG, PNG, TIFF, BMP, GIF), along with control over page settings, color spaces, document structure, and vector content. Both libraries operate without dependencies on external software, making them ideal for embedding in modern web apps or backend services.
These products are particularly well-suited for scenarios where precise document rendering and format conversion are required. With Aspose.Page, developers can automate the transformation of PS, EPS, or XPS documents into PDFs or images for publishing, archiving, or web display. The libraries also support operations such as merging files, editing document metadata, and preserving complex graphical content, making them valuable in print workflows, digital asset pipelines, and compliance-driven industries. The JavaScript version enables interactive document processing within the browser, while the Node.js variant supports scalable automation on the server. Both options offer high fidelity and performance, enabling seamless integration into document management systems and web-based PDF workflows
Aspose products are offered as Developer Small Business, Developer OEM, Developer SDK, Site Small Business, Site OEM and Site SDK licenses catering to a range of business needs. Licenses are perpetual, and include 1 year of support and maintenance. Subscription renewals are also available. For full details, see our licensing pages for JavaScript via C++ and Node.js via C++.
These new products are available individually or as part of several suites, including: Aspose.Total Product Family.





Tel: (888) 850 9911
Fax: +1 770 250 6199


