


Official Supplier
As official and authorized distributors, we supply you with legitimate licenses directly from 200+ software publishers.
See all our Brands.

Mail merge in reporting software is a feature that allows users to automatically generate letters, labels, and other documents by merging a template with data. This is typically used to create personalized documents in bulk, such as invoices, form letters, or address labels, saving time and reducing errors compared to manually entering information. Mail merge is widely used in marketing, customer service, and administrative tasks, making it a valuable asset for any organization sending bulk communications.
Several WPF Reporting controls provide Mail Merge functionality including:
For an in-depth analysis of features and price, visit our WPF Reporting Controls comparison.
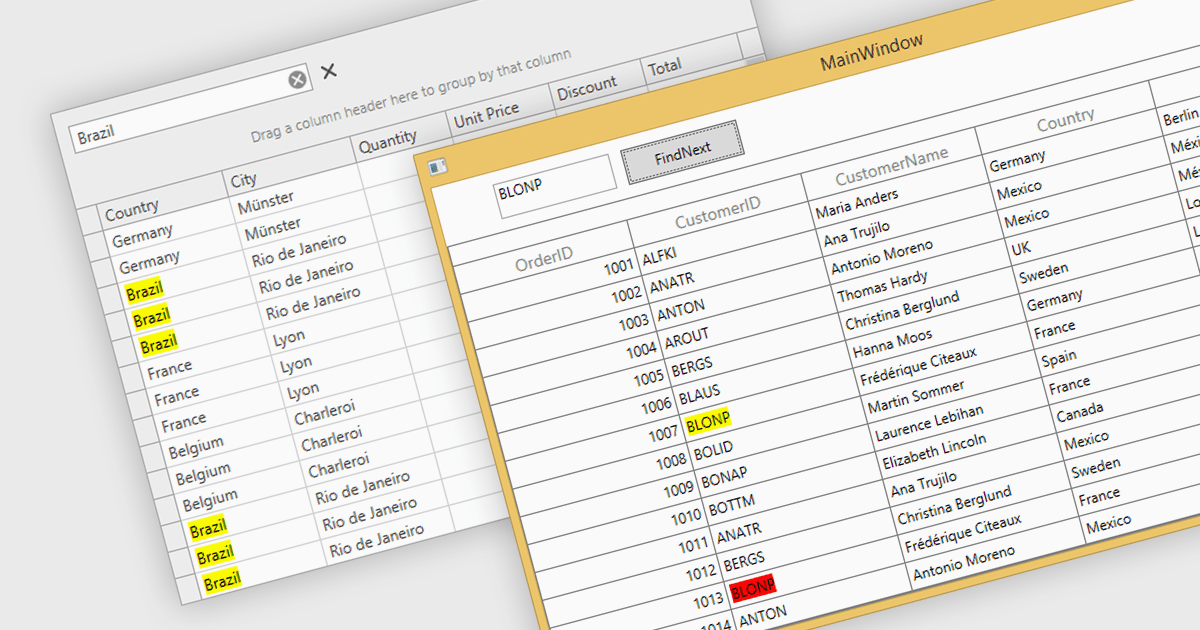
Searching within a grid enables users to quickly find specific data points by entering search criteria. For large datasets, navigating to specific data points can be a monumental task, often requiring time-consuming manual scrolling. Grid search allows users to pinpoint desired data within seconds, boosting productivity and streamlining analysis. This eliminates the need for tedious browsing and empowers users to quickly identify trends, patterns, and outliers, enabling deeper insights and informed decision-making.
Several WPF grids support searching including:
For an in-depth analysis of features and price, visit our WPF grids comparison.
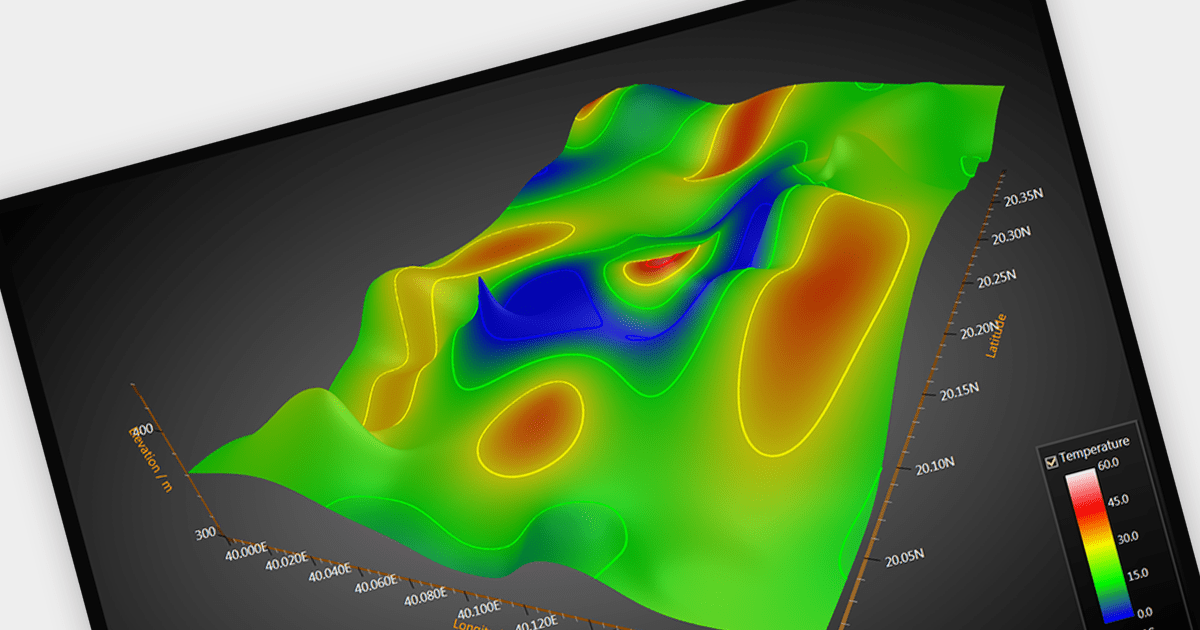
Surface charts are graphical representations that depict three-dimensional data in a two-dimensional format, typically using a grid of rows and columns. These charts provide a visual representation of how two independent variables (typically represented on the X and Y axes) influence a dependent variable, represented by the height or color of the surface. The primary benefit of surface charts lies in their ability to reveal complex relationships within datasets, making it easier for analysts and decision-makers to grasp patterns and trends. Surface charts offer a valuable tool for analyzing data in fields such as scientific research, engineering, finance, and various other domains.
Several WPF chart controls offer Surface charts including:
For an in-depth analysis of features and price, visit our WPF chart controls comparison.
Syncfusion Essential Studio WPF, available as part of Syncfusion Essential Studio Enterprise, is a powerful suite of over 95 UI controls, 50+ charts, and document processing libraries designed to boost the development of high-performance line-of-business applications for the Windows Presentation Foundation (WPF) framework. With built-in themes, touch-friendly interfaces, and seamless Visual Studio integration, it empowers developers to craft modern, feature-rich, and cross-platform experiences with ease.
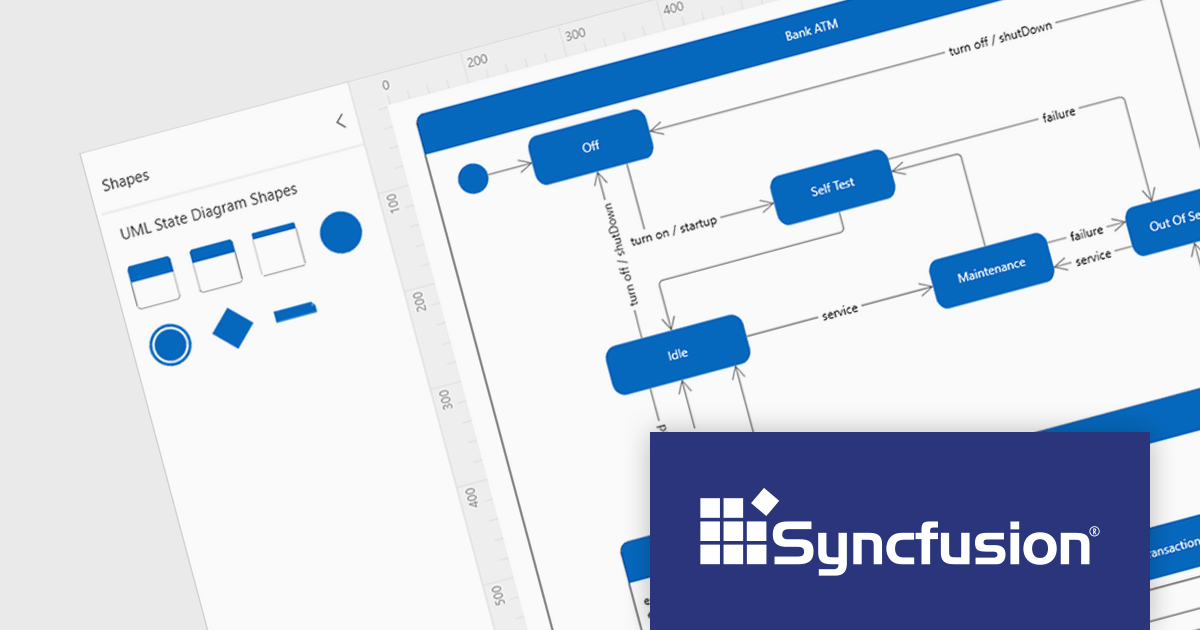
Version 2023 Volume 4 (24.1.41) adds the ability to create UML (Unified Modeling Language) state diagrams both programmatically and interactively using built-in UML state diagram symbols. This allows you to code your diagrams for robust automation and maintainability, or visually design intricate logic with built-in symbols. UML state diagrams visually depict the dynamic behavior of an object or system, focusing on the finite states it can occupy and the events that trigger transitions between them. These diagrams showcase the system's life cycle, highlighting valid sequences of events and ensuring predictable responses.
To see a full list of what's new in version 2023 Volume 4 (24.1.41), see our release notes.
Syncfusion Essential Studio WPF is available as part of Syncfusion Essential Studio Enterprise which is licensed per developer starting with a Team License of up to five developers. It is available as a 12 Month Timed Subscription License which includes support and maintenance. See our Syncfusion Essential Studio Enterprise licensing page for full details.
For more information, visit our Syncfusion Essential Studio WPF product page.
Stimulsoft Reports is a versatile reporting tool that lets you create and generate reports of any complexity from scratch, whether for desktop, web, or mobile platforms. It provides a visual designer and royalty-free runtime that integrates seamlessly with various frameworks like ASP.NET, Java, and JavaScript, empowering applications to generate insightful reports with rich features and diverse export options.
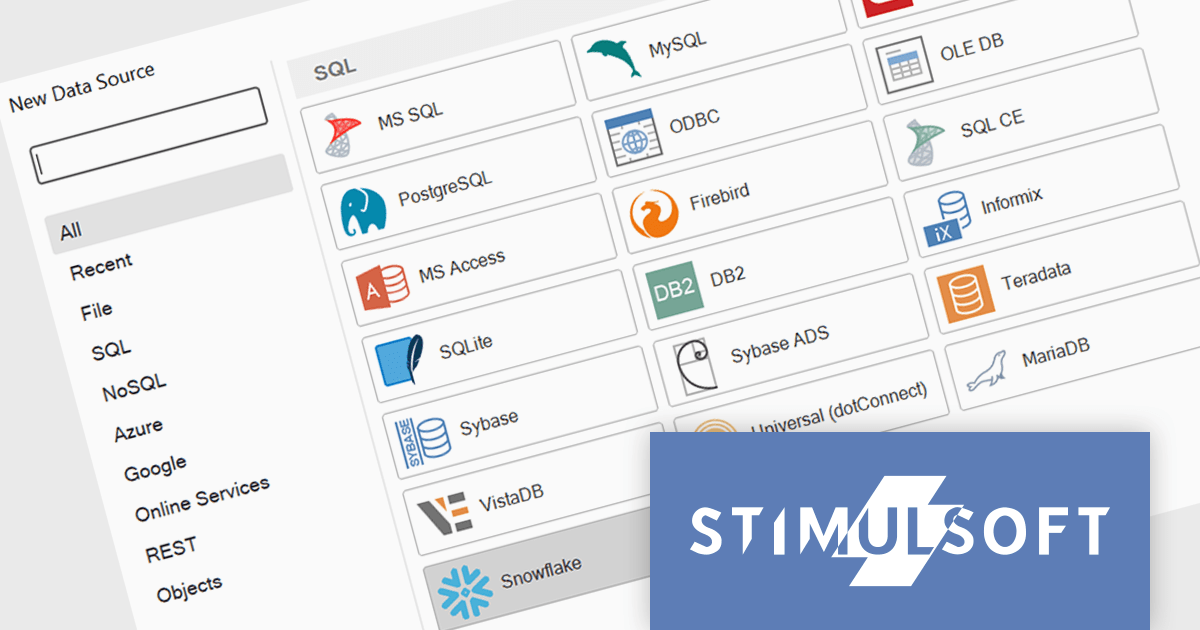
The 2024.1.1 release of Stimulsoft Reports adds a new data adapter for Snowflake, a widely used cloud data storage services, adept at handling both semi-structured and structured data. Developers can now utilize Stimulsoft's robust reporting capabilities to analyze Snowflake data directly, eliminating the need for manual data extraction or intermediary tools. This translates to faster report generation, improved data accuracy, and seamless integration with Snowflake's powerful cloud storage and performance.
To see a full list of what's new in version 2024.1.1, see our release notes.
Stimulsoft Ultimate is licensed per developer and is available as a Perpetual license with 1 year support and maintenance. See our Stimulsoft Ultimate licensing page for full details.
Stimulsoft Reports is available to buy in the following products:


Tel: (888) 850 9911
Fax: +1 770 250 6199


