


Official Supplier
As official and authorized distributors, we supply you with legitimate licenses directly from 200+ software publishers.
See all our Brands.
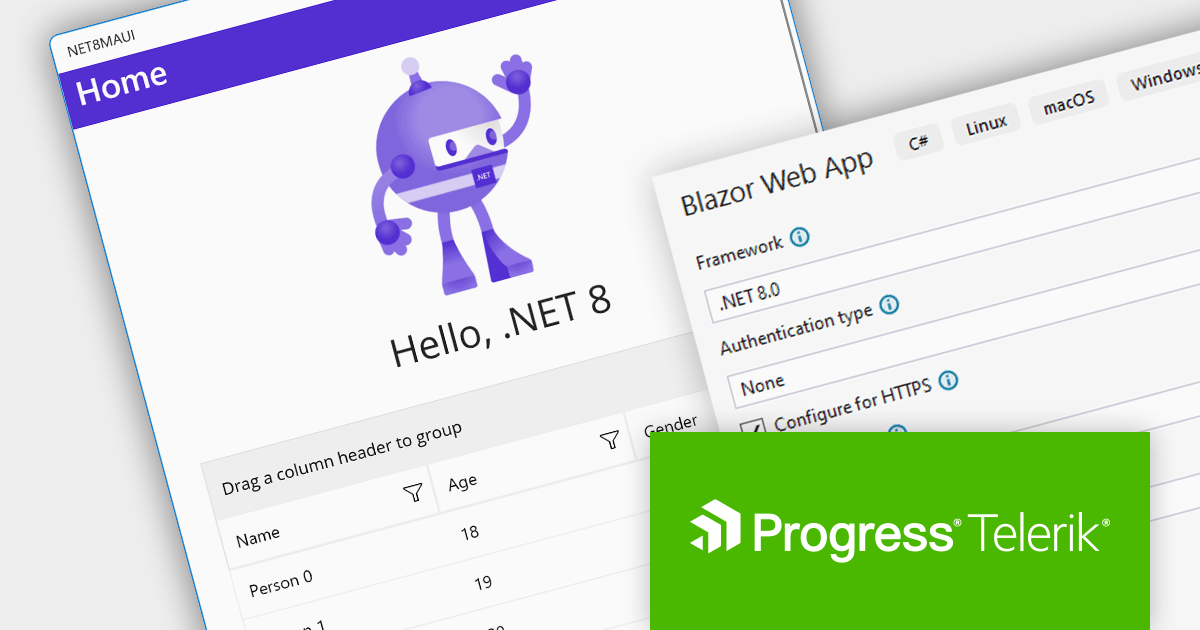
Progress Telerik is a leading software publisher that provides a range of tools and solutions to help developers build and deploy modern applications. Its product range include UI libraries, reporting tools and testing frameworks. Telerik products are used by millions of developers around the world to build a wide variety of applications.
The following Telerik products have been updated with support for .NET 8, allowing developers to build web, desktop, mobile and reporting apps in the latest version of Microsoft's popular framework:
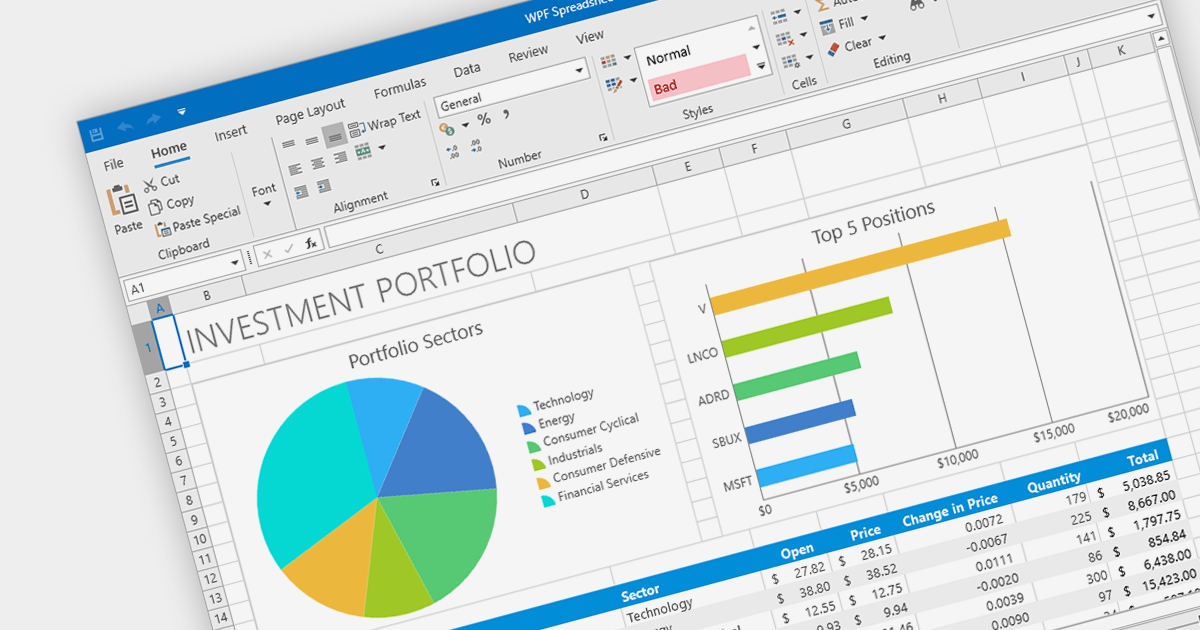
Charts are integral to spreadsheets, enabling users to transform data into visually compelling representations. These graphical formats, such as pie, line, bar, and area charts, effectively convey complex information by highlighting trends, patterns, and anomalies. Spreadsheet software with advanced charting capabilities empowers users to create dynamic charts that adapt seamlessly to data updates, making them invaluable tools for reporting, presentations, and data analysis.
Several .NET WPF spreadsheet components provide chart support including:
For an in-depth analysis of features and price, visit our comparison of .NET Spreadsheet components.
DevExpress Reporting is a powerful and flexible reporting solution for .NET developers. It allows you to create reports of any complexity, from simple data tables to complex dashboards and interactive visualizations. DevExpress Reporting supports a wide range of data sources, including SQL databases, Entity Framework, and custom objects. It also offers a variety of export options, including PDF, XLSX, HTML, and RTF.
DevExpress Reporting is also available as part DevExpress DXperience and DevExpress Universal, a suite of over 600 UI controls and libraries for building high-impact business solutions for Windows Forms, WPF, ASP.NET, Blazor and more.
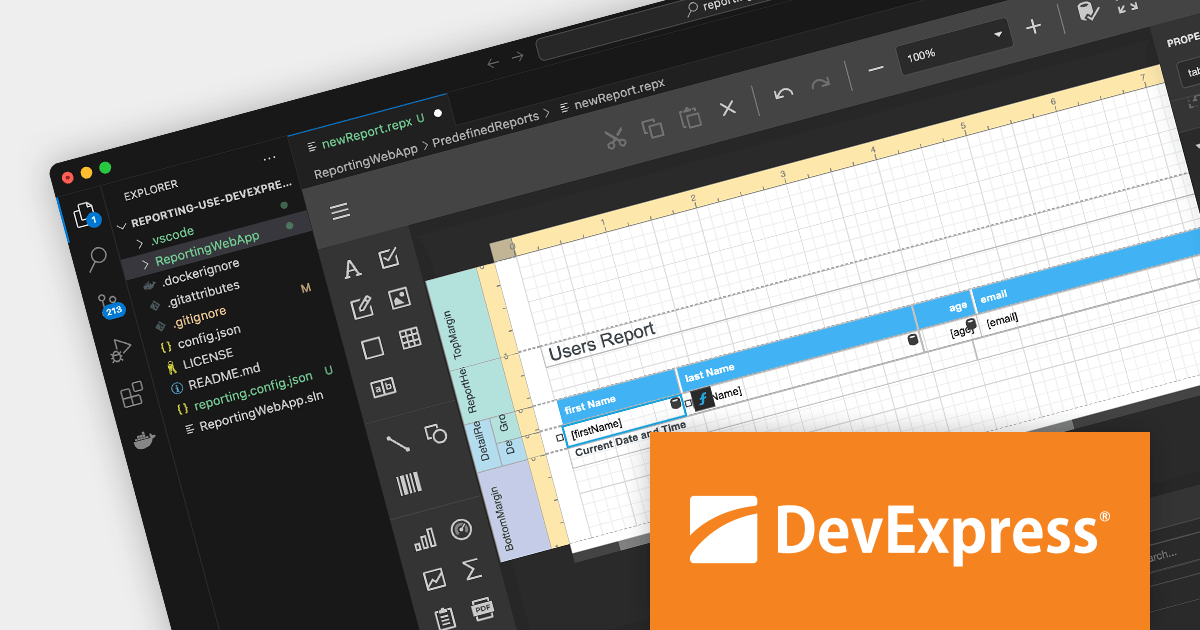
Create and Modify DevExpress Reports in Visual Studio Code (VS Code) on macOS and Linux (CTP).
The DevExpress Visual Studio Code Report Designer Extension allows you to create and edit DevExpress Report documents within the Visual Studio Code IDE.
A recent blog post by the DevExpress Reporting Team guides you through the setup process on macOS and illustrates how you can leverage the extension's capabilities to develop and modify existing reports.
Read the full blog now to learn more about this powerful capability.
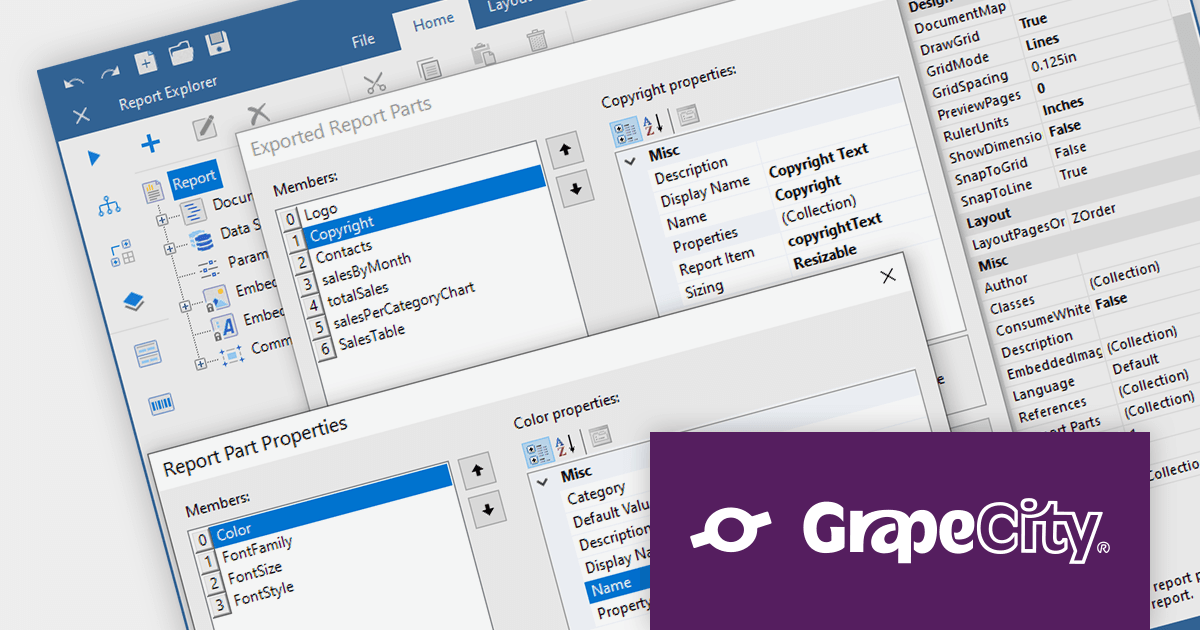
ActiveReports.NET is a reporting tool that allows developers to design and deliver reports with intuitive, reliable, and user-friendly report designers and controls. Features include the ability to create reports in a variety of formats, such as PDF, Excel, and HTML. ActiveReports.NET is also highly customizable, with an extensive API and advanced feature library.
ActiveReports.NET v17.2 introduces Report Parts, which can be created from any report item, including tables, charts, text boxes, and images. These Report Parts are created by developers and added to the ActiveReports toolbox for end-users to drag and drop onto the design surface. This makes it easy for end-users to create complex reports without having to learn the intricacies of report design. Developers can specify the properties of the Report Part, such as its data binding, formatting, and visibility so that they that are tailored to the specific needs of their users.
To see a full list of what's new in version 17.2, see our release notes.
For more information, visit our ActiveReports.NET product page.

Exporting charts to PDF enables developers to save charts as PDF documents, ensuring their appearance and data are preserved for sharing, printing, or archival purposes. It allows seamless integration of charting capabilities within WPF applications and facilitates the generation of high-quality, portable chart representations in PDF format.
Here is a selection of WPF chart controls that offer PDF export support:
Additionally, the following charting components are available as part of multi-function component suites:
For an in-depth analysis of features and price, visit our comparison of .NET 7 charts.


Tel: (888) 850 9911
Fax: +1 770 250 6199


